Quantcast
Channel: Severalnines - MySQL
Viewing all 606 articles
Browse latest View live

Deploying a Highly Available Nextcloud with MySQL Galera Cluster and GlusterFS

$
0
0

Nextcloud is an open source file sync and share application that offers free, secure, and easily accessible cloud file storage, as well as a number of tools that extend its feature set. It's very similar to the popular Dropbox, iCloud and Google Drive but unlike Dropbox, Nextcloud does not offer off-premises file storage hosting. 

Nextcloud Logo

In this blog post, we are going to deploy a high-available setup for our private "Dropbox" infrastructure using Nextcloud, GlusterFS, Percona XtraDB Cluster (MySQL Galera Cluster), ProxySQL with ClusterControl as the automation tool to manage and monitor the database and load balancer tiers. 

Note: You can also use MariaDB Cluster, which uses the same underlying replication library as in Percona XtraDB Cluster. From a load balancer perspective, ProxySQL behaves similarly to MaxScale in that it can understand the SQL traffic and has fine-grained control on how traffic is routed. 

Database Architecture for Nexcloud

In this blog post, we used a total of 6 nodes.

  • 2 x proxy servers 
  • 3 x database + application servers
  • 1 x controller server (ClusterControl)

The following diagram illustrates our final setup:

Highly Available MySQL Nextcloud Database Architecture

For Percona XtraDB Cluster, a minimum of 3 nodes is required for a solid multi-master replication. Nextcloud applications are co-located within the database servers, thus GlusterFS has to be configured on those hosts as well. 

Load balancer tier consists of 2 nodes for redundancy purposes. We will use ClusterControl to deploy the database tier and the load balancer tiers. All servers are running on CentOS 7 with the following /etc/hosts definition on every node:

192.168.0.21 nextcloud1 db1

192.168.0.22 nextcloud2 db2

192.168.0.23 nextcloud3 db3

192.168.0.10 vip db

192.168.0.11 proxy1 lb1 proxysql1

192.168.0.12 proxy2 lb2 proxysql2

Note that GlusterFS and MySQL are highly intensive processes. If you are following this setup (GlusterFS and MySQL resides in a single server), ensure you have decent hardware specs for the servers.

Nextcloud Database Deployment

We will start with database deployment for our three-node Percona XtraDB Cluster using ClusterControl. Install ClusterControl and then setup passwordless SSH to all nodes that are going to be managed by ClusterControl (3 PXC + 2 proxies). On ClusterControl node, do:

$ whoami

root

$ ssh-copy-id 192.168.0.11

$ ssh-copy-id 192.168.0.12

$ ssh-copy-id 192.168.0.21

$ ssh-copy-id 192.168.0.22

$ ssh-copy-id 192.168.0.23

**Enter the root password for the respective host when prompted.

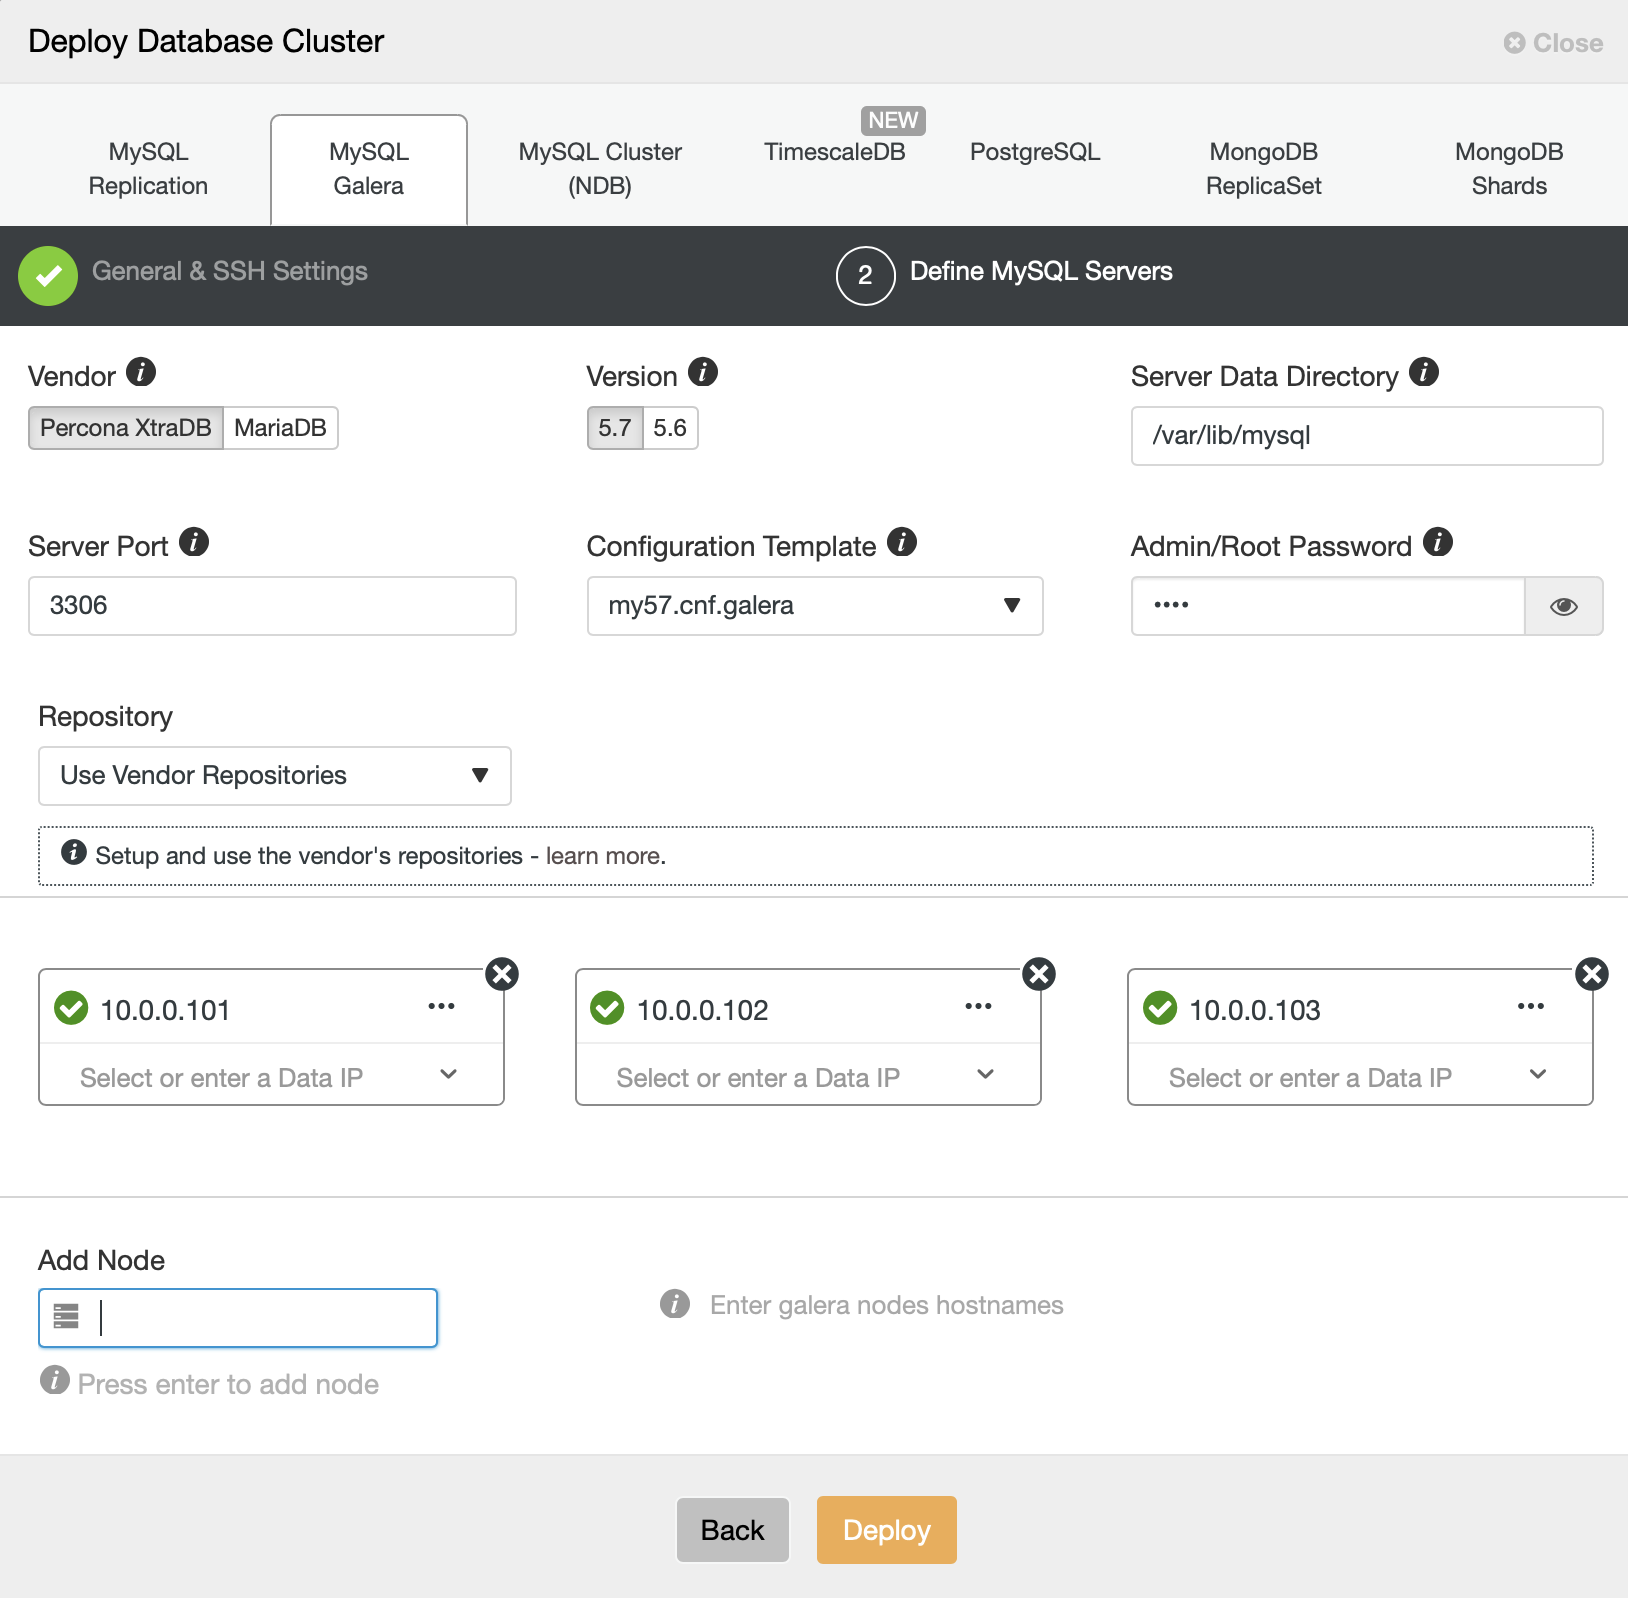
Open a web browser and go to https://{ClusterControl-IP-address}/clustercontrol and create a super user. Then go to Deploy -> MySQL Galera. Follow the deployment wizard accordingly. At the second stage 'Define MySQL Servers', pick Percona XtraDB 5.7 and specify the IP address for every database node. Make sure you get a green tick after entering the database node details, as shown below:

Deploy a Nextcloud Database Cluster

Click "Deploy" to start the deployment. The database cluster will be ready in 15~20 minutes. You can follow the deployment progress at Activity -> Jobs -> Create Cluster -> Full Job Details. The cluster will be listed under Database Cluster dashboard once deployed.

We can now proceed to database load balancer deployment.

Nextcloud Database Load Balancer Deployment

Nextcloud is recommended to run on a single-writer setup, where writes will be processed by one master at a time, and the reads can be distributed to other nodes. We can use ProxySQL 2.0 to achieve this configuration since it can route the write queries to a single master. 

To deploy a ProxySQL, click on Cluster Actions > Add Load Balancer > ProxySQL > Deploy ProxySQL. Enter the required information as highlighted by the red arrows:

Deploy ProxySQL for Nextcloud

Fill in all necessary details as highlighted by the arrows above. The server address is the lb1 server, 192.168.0.11. Further down, we specify the ProxySQL admin and monitoring users' password. Then include all MySQL servers into the load balancing set and then choose "No" in the Implicit Transactions section. Click "Deploy ProxySQL" to start the deployment.

Repeat the same steps as above for the secondary load balancer, lb2 (but change the "Server Address" to lb2's IP address). Otherwise, we would have no redundancy in this layer.

Our ProxySQL nodes are now installed and configured with two host groups for Galera Cluster. One for the single-master group (hostgroup 10), where all connections will be forwarded to one Galera node (this is useful to prevent multi-master deadlocks) and the multi-master group (hostgroup 20) for all read-only workloads which will be balanced to all backend MySQL servers.

Next, we need to deploy a virtual IP address to provide a single endpoint for our ProxySQL nodes so your application will not need to define two different ProxySQL hosts. This will also provide automatic failover capabilities because virtual IP address will be taken over by the backup ProxySQL node in case something goes wrong to the primary ProxySQL node.

Go to ClusterControl -> Manage -> Load Balancers -> Keepalived -> Deploy Keepalived. Pick "ProxySQL" as the load balancer type and choose two distinct ProxySQL servers from the dropdown. Then specify the virtual IP address as well as the network interface that it will listen to, as shown in the following example:

Deploy Keepalived & ProxySQL for Nextcloud

Once the deployment completes, you should see the following details on the cluster's summary bar:

Nextcloud Database Cluster in ClusterControl

Finally, create a new database for our application by going to ClusterControl -> Manage -> Schemas and Users -> Create Database and specify "nextcloud". ClusterControl will create this database on every Galera node. Our load balancer tier is now complete.

GlusterFS Deployment for Nextcloud

The following steps should be performed on nextcloud1, nextcloud2, nextcloud3 unless otherwise specified.

Step One

It's recommended to have a separate this for GlusterFS storage, so we are going to add additional disk under /dev/sdb and create a new partition:

$ fdisk /dev/sdb

Follow the fdisk partition creation wizard by pressing the following key:

n > p > Enter > Enter > Enter > w

Step Two

Verify if /dev/sdb1 has been created:

$ fdisk -l /dev/sdb1

Disk /dev/sdb1: 8588 MB, 8588886016 bytes, 16775168 sectors

Units = sectors of 1 * 512 = 512 bytes

Sector size (logical/physical): 512 bytes / 512 bytes

I/O size (minimum/optimal): 512 bytes / 512 bytes

Step Three

Format the partition with XFS:

$ mkfs.xfs /dev/sdb1

Step Four

Mount the partition as /storage/brick:

$ mkdir /glusterfs

$ mount /dev/sdb1 /glusterfs

Verify that all nodes have the following layout:

$ lsblk

NAME   MAJ:MIN RM SIZE RO TYPE MOUNTPOINT

sda      8:0 0 40G  0 disk

└─sda1   8:1 0 40G  0 part /

sdb      8:16 0   8G 0 disk

└─sdb1   8:17 0   8G 0 part /glusterfs

Step Five

Create a subdirectory called brick under /glusterfs:

$ mkdir /glusterfs/brick

Step Six

For application redundancy, we can use GlusterFS for file replication between the hosts. Firstly, install GlusterFS repository for CentOS:

$ yum install centos-release-gluster -y

$ yum install epel-release -y

Step Seven

Install GlusterFS server

$ yum install glusterfs-server -y

Step Eight

Enable and start gluster daemon:

$ systemctl enable glusterd

$ systemctl start glusterd

Step Nine

On nextcloud1, probe the other nodes:

(nextcloud1)$ gluster peer probe 192.168.0.22

(nextcloud1)$ gluster peer probe 192.168.0.23

You can verify the peer status with the following command:

(nextcloud1)$ gluster peer status

Number of Peers: 2


Hostname: 192.168.0.22

Uuid: f9d2928a-6b64-455a-9e0e-654a1ebbc320

State: Peer in Cluster (Connected)


Hostname: 192.168.0.23

Uuid: 100b7778-459d-4c48-9ea8-bb8fe33d9493

State: Peer in Cluster (Connected)

Step Ten

On nextcloud1, create a replicated volume on probed nodes:

(nextcloud1)$ gluster volume create rep-volume replica 3 192.168.0.21:/glusterfs/brick 192.168.0.22:/glusterfs/brick 192.168.0.23:/glusterfs/brick

volume create: rep-volume: success: please start the volume to access data

Step Eleven

Start the replicated volume on nextcloud1:

(nextcloud1)$ gluster volume start rep-volume

volume start: rep-volume: success

Verify the replicated volume and processes are online:

$ gluster volume status

Status of volume: rep-volume

Gluster process                             TCP Port RDMA Port Online Pid

------------------------------------------------------------------------------

Brick 192.168.0.21:/glusterfs/brick         49152 0 Y 32570

Brick 192.168.0.22:/glusterfs/brick         49152 0 Y 27175

Brick 192.168.0.23:/glusterfs/brick         49152 0 Y 25799

Self-heal Daemon on localhost               N/A N/A Y 32591

Self-heal Daemon on 192.168.0.22            N/A N/A Y 27196

Self-heal Daemon on 192.168.0.23            N/A N/A Y 25820


Task Status of Volume rep-volume

------------------------------------------------------------------------------

There are no active volume tasks

Step Twelve

Mount the replicated volume on /var/www/html. Create the directory:

$ mkdir -p /var/www/html

Step Thirteen

13) Add following line into /etc/fstab to allow auto-mount:

/dev/sdb1 /glusterfs xfs defaults,defaults 0 0

localhost:/rep-volume /var/www/html   glusterfs defaults,_netdev 0 0

Step Fourteen

Mount the GlusterFS to /var/www/html:

$ mount -a

And verify with:

$ mount | grep gluster

/dev/sdb1 on /glusterfs type xfs (rw,relatime,seclabel,attr2,inode64,noquota)

localhost:/rep-volume on /var/www/html type fuse.glusterfs (rw,relatime,user_id=0,group_id=0,default_permissions,allow_other,max_read=131072)

The replicated volume is now ready and mounted in every node. We can now proceed to deploy the application.

Nextcloud Application Deployment

The following steps should be performed on nextcloud1, nextcloud2 and nextcloud3 unless otherwise specified.

Nextcloud requires PHP 7.2 and later and for CentOS distribution, we have to enable a number of repositories like EPEL and Remi to simplify the installation process.

Step One

If SELinux is enabled, disable it first:

$ setenforce 0

$ sed -i 's/^SELINUX=.*/SELINUX=permissive/g' /etc/selinux/config

You can also run Nextcloud with SELinux enabled by following this guide.

Step Two

Install Nextcloud requirements and enable Remi repository for PHP 7.2:

$ yum install -y epel-release yum-utils unzip curl wget bash-completion policycoreutils-python mlocate bzip2

$ yum install -y http://rpms.remirepo.net/enterprise/remi-release-7.rpm

$ yum-config-manager --enable remi-php72

Step Three

Install Nextcloud dependencies, mostly Apache and PHP 7.2 related packages:

$ yum install -y httpd php72-php php72-php-gd php72-php-intl php72-php-mbstring php72-php-mysqlnd php72-php-opcache php72-php-pecl-redis php72-php-pecl-apcu php72-php-pecl-imagick php72-php-xml php72-php-pecl-zip

Step Four

Enable Apache and start it up:

$ systemctl enable httpd.service

$ systemctl start httpd.service

Step Five

Make a symbolic link for PHP to use PHP 7.2 binary:

$ ln -sf /bin/php72 /bin/php

Step Six

On nextcloud1, download Nextcloud Server from here and extract it:

$ wget https://download.nextcloud.com/server/releases/nextcloud-17.0.0.zip

$ unzip nextcloud*

Step Seven

On nextcloud1, copy the directory into /var/www/html and assign correct ownership:

$ cp -Rf nextcloud /var/www/html

$ chown -Rf apache:apache /var/www/html

**Note the copying process into /var/www/html is going to take some time due to GlusterFS volume replication.

Step Eight

Before we proceed to open the installation wizard, we have to disable pxc_strict_mode variable to other than "ENFORCING" (the default value). This is due to the fact that Nextcloud database import will have a number of tables without primary key defined which is not recommended to run on Galera Cluster. This is explained further details under Tuning section further down.

To change the configuration with ClusterControl, simply go to Manage -> Configurations -> Change/Set Parameters:

Change Set Parameters - ClusterControl

Choose all database instances from the list, and enter:

  • Group: MYSQLD
  • Parameter: pxc_strict_mode
  • New Value: PERMISSIVE

ClusterControl will perform the necessary changes on every database node automatically. If the value can be changed during runtime, it will be effective immediately. ClusterControl also configure the value inside MySQL configuration file for persistency. You should see the following result:

Change Set Parameter - ClusterControl

Step Nine

Now we are ready to configure our Nextcloud installation. Open the browser and go to nextcloud1's HTTP server at http://192.168.0.21/nextcloud/ and you will be presented with the following configuration wizard:

Nextcloud Account Setup

Configure the "Storage & database" section with the following value:

  • Data folder: /var/www/html/nextcloud/data
  • Configure the database: MySQL/MariaDB
  • Username: nextcloud
  • Password: (the password for user nextcloud)
  • Database: nextcloud
  • Host: 192.168.0.10:6603 (The virtual IP address with ProxySQL port)

Click "Finish Setup" to start the configuration process. Wait until it finishes and you will be redirected to Nextcloud dashboard for user "admin". The installation is now complete. Next section provides some tuning tips to run efficiently with Galera Cluster.

Nextcloud Database Tuning

Primary Key

Having a primary key on every table is vital for Galera Cluster write-set replication. For a relatively big table without primary key, large update or delete transaction would completely block your cluster for a very long time. To avoid any quirks and edge cases, simply make sure that all tables are using InnoDB storage engine with an explicit primary key (unique key does not count).

The default installation of Nextcloud will create a bunch of tables under the specified database and some of them do not comply with this rule. To check if the tables are compatible with Galera, we can run the following statement:

mysql> SELECT DISTINCT CONCAT(t.table_schema,'.',t.table_name) as tbl, t.engine, IF(ISNULL(c.constraint_name),'NOPK','') AS nopk, IF(s.index_type = 'FULLTEXT','FULLTEXT','') as ftidx, IF(s.index_type = 'SPATIAL','SPATIAL','') as gisidx FROM information_schema.tables AS t LEFT JOIN information_schema.key_column_usage AS c ON (t.table_schema = c.constraint_schema AND t.table_name = c.table_name AND c.constraint_name = 'PRIMARY') LEFT JOIN information_schema.statistics AS s ON (t.table_schema = s.table_schema AND t.table_name = s.table_name AND s.index_type IN ('FULLTEXT','SPATIAL'))   WHERE t.table_schema NOT IN ('information_schema','performance_schema','mysql') AND t.table_type = 'BASE TABLE' AND (t.engine <> 'InnoDB' OR c.constraint_name IS NULL OR s.index_type IN ('FULLTEXT','SPATIAL')) ORDER BY t.table_schema,t.table_name;

+---------------------------------------+--------+------+-------+--------+

| tbl                                   | engine | nopk | ftidx | gisidx |

+---------------------------------------+--------+------+-------+--------+

| nextcloud.oc_collres_accesscache      | InnoDB | NOPK | | |

| nextcloud.oc_collres_resources        | InnoDB | NOPK | | |

| nextcloud.oc_comments_read_markers    | InnoDB | NOPK | | |

| nextcloud.oc_federated_reshares       | InnoDB | NOPK | | |

| nextcloud.oc_filecache_extended       | InnoDB | NOPK | | |

| nextcloud.oc_notifications_pushtokens | InnoDB | NOPK |       | |

| nextcloud.oc_systemtag_object_mapping | InnoDB | NOPK |       | |

+---------------------------------------+--------+------+-------+--------+

The above output shows there are 7 tables that do not have a primary key defined. To fix the above, simply add a primary key with auto-increment column. Run the following commands on one of the database servers, for example nexcloud1:

(nextcloud1)$ mysql -uroot -p

mysql> ALTER TABLE nextcloud.oc_collres_accesscache ADD COLUMN `id` INT PRIMARY KEY AUTO_INCREMENT;

mysql> ALTER TABLE nextcloud.oc_collres_resources ADD COLUMN `id` INT PRIMARY KEY AUTO_INCREMENT;

mysql> ALTER TABLE nextcloud.oc_comments_read_markers ADD COLUMN `id` INT PRIMARY KEY AUTO_INCREMENT;

mysql> ALTER TABLE nextcloud.oc_federated_reshares ADD COLUMN `id` INT PRIMARY KEY AUTO_INCREMENT;

mysql> ALTER TABLE nextcloud.oc_filecache_extended ADD COLUMN `id` INT PRIMARY KEY AUTO_INCREMENT;

mysql> ALTER TABLE nextcloud.oc_notifications_pushtokens ADD COLUMN `id` INT PRIMARY KEY AUTO_INCREMENT;

mysql> ALTER TABLE nextcloud.oc_systemtag_object_mapping ADD COLUMN `id` INT PRIMARY KEY AUTO_INCREMENT;

Once the above modifications have been applied, we can reconfigure back the pxc_strict_mode to the recommended value, "ENFORCING". Repeat step #8 under "Application Deployment" section with the corresponding value.

READ-COMMITTED Isolation Level

The recommended transaction isolation level as advised by Nextcloud is to use READ-COMMITTED, while Galera Cluster is default to stricter REPEATABLE-READ isolation level. Using READ-COMMITTED can avoid data loss under high load scenarios (e.g. by using the sync client with many clients/users and many parallel operations).

To modify the transaction level, go to ClusterControl -> Manage -> Configurations -> Change/Set Parameter and specify the following:

Nextcloud Change Set Parameter - ClusterControl

Click "Proceed" and ClusterControl will apply the configuration changes immediately. No database restart is required.

Multi-Instance Nextcloud

Since we performed the installation on nextcloud1 when accessing the URL, this IP address is automatically added into 'trusted_domains' variable inside Nextcloud. When you tried to access other servers, for example the secondary server, http://192.168.0.22/nextcloud, you would see an error that this is host is not authorized and must be added into the trusted_domain variable.

Therefore, add all the hosts IP address under "trusted_domain" array inside /var/www/html/nextcloud/config/config.php, as example below:

  'trusted_domains' =>

  array (

    0 => '192.168.0.21',

    1 => '192.168.0.22',

    2 => '192.168.0.23'

  ),

The above configuration allows users to access all three application servers via the following URLs:

Note: You can add a load balancer tier on top of these three Nextcloud instances to achieve high availability for the application tier by using HTTP reverse proxies available in the market like HAProxy or nginx. That is out of the scope of this blog post.

Using Redis for File Locking

Nextcloud’s Transactional File Locking mechanism locks files to avoid file corruption during normal operation. It's recommended to install Redis to take care of transactional file locking (this is enabled by default) which will offload the database cluster from handling this heavy job.

To install Redis, simply:

$ yum install -y redis

$ systemctl enable redis.service

$ systemctl start redis.service

Append the following lines inside /var/www/html/nextcloud/config/config.php:

  'filelocking.enabled' => true,

  'memcache.locking' => '\OC\Memcache\Redis',

  'redis' => array(

     'host' => '192.168.0.21',

     'port' => 6379,

     'timeout' => 0.0,

   ),

For more details, check out this documentation, Transactional File Locking.

Conclusion

Nextcloud can be configured to be a scalable and highly available file-hosting service to cater for your private file sharing demands. In this blog, we showed how you can bring redundancy in the Nextcloud, file system and database layers. 


Database Load Balancing in the Cloud - MySQL Master Failover with ProxySQL 2.0: Part One (Deployment)

$
0
0

The cloud provides very flexible environments to work with. You can easily scale it up and down by adding or removing nodes. If there’s a need, you can easily create a clone of your environment. This can be used for processes like upgrades, load tests, disaster recovery. The main problem you have to deal with is that applications have to connect to the databases in some way, and flexible setups can be tricky for databases - especially with master-slave setups. Luckily, there are some options to make this process easier. 

One way is to utilize a database proxy. There are several proxies to pick from, but in this blog post we will use ProxySQL, a well known proxy available for MySQL and MariaDB. We are going to show how you can use it to efficiently move traffic between MySQL nodes without visible impact for the application. We are also going to explain some limitations and drawbacks of this approach.

Initial Cloud Setup

At first, let’s discuss the setup. We will use AWS EC2 instances for our environment. As we are only testing, we don’t really care about high availability other than what we want to prove to be possible - seamless master changes. Therefore we will use a single application node and a single ProxySQL node. As per good practices, we will collocate ProxySQL on the application node and the application will be configured to connect to ProxySQL through Unix socket. This will reduce overhead related to TCP connections and increase security - traffic from the application to the proxy will not leave the local instance, leaving only ProxySQL - > MySQL connection to encrypt. Again, as this is a simple test, we will not setup SSL. In production environments you want to do that, even if you use VPC.

The environment will look like in the diagram below:

As the application, we will use Sysbench - a synthetic benchmark program for MySQL. It has an option to disable and enable the use of transactions, which we will use to demonstrate how ProxySQL handles them.

Installing a MySQL Replication Cluster Using ClusterControl

To make the deployment fast and efficient, we are going to use ClusterControl to deploy the MySQL replication setup for us. The installation of ClusterControl requires just a couple of steps. We won’t go into details here but you should open our website, register and installation of ClusterControl should be pretty much straightforward. Please keep in mind that you need to setup passwordless SSH between ClusterControl instance and all nodes that we will be managing with it.

Once ClusterControl has been installed, you can log in. You will be presented with a deployment wizard:

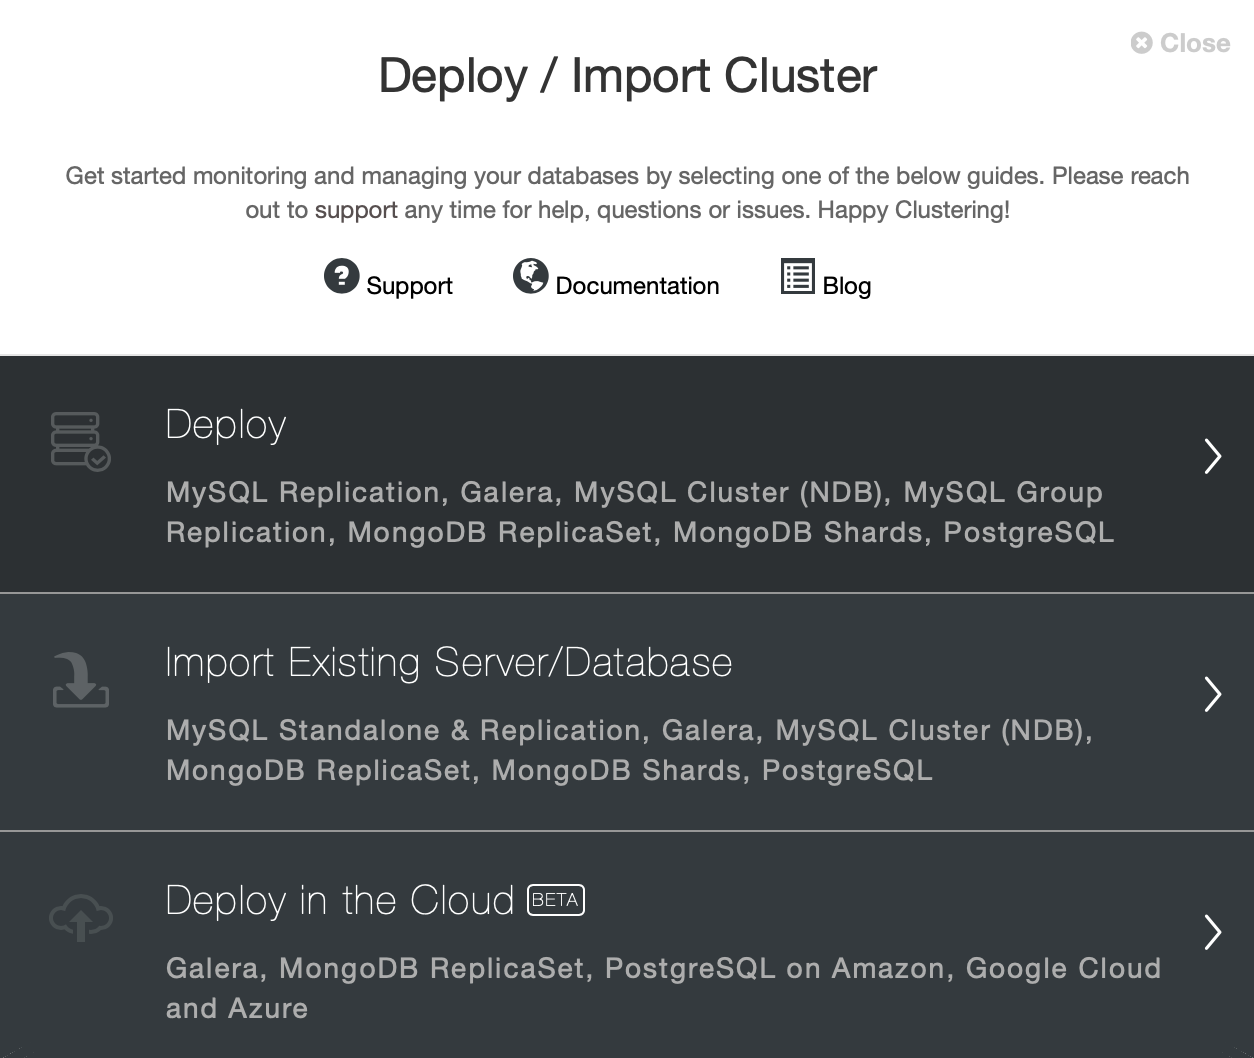
As we already have instances running in cloud, therefore we will just go with “Deploy” option. We will be presented with the following screen:

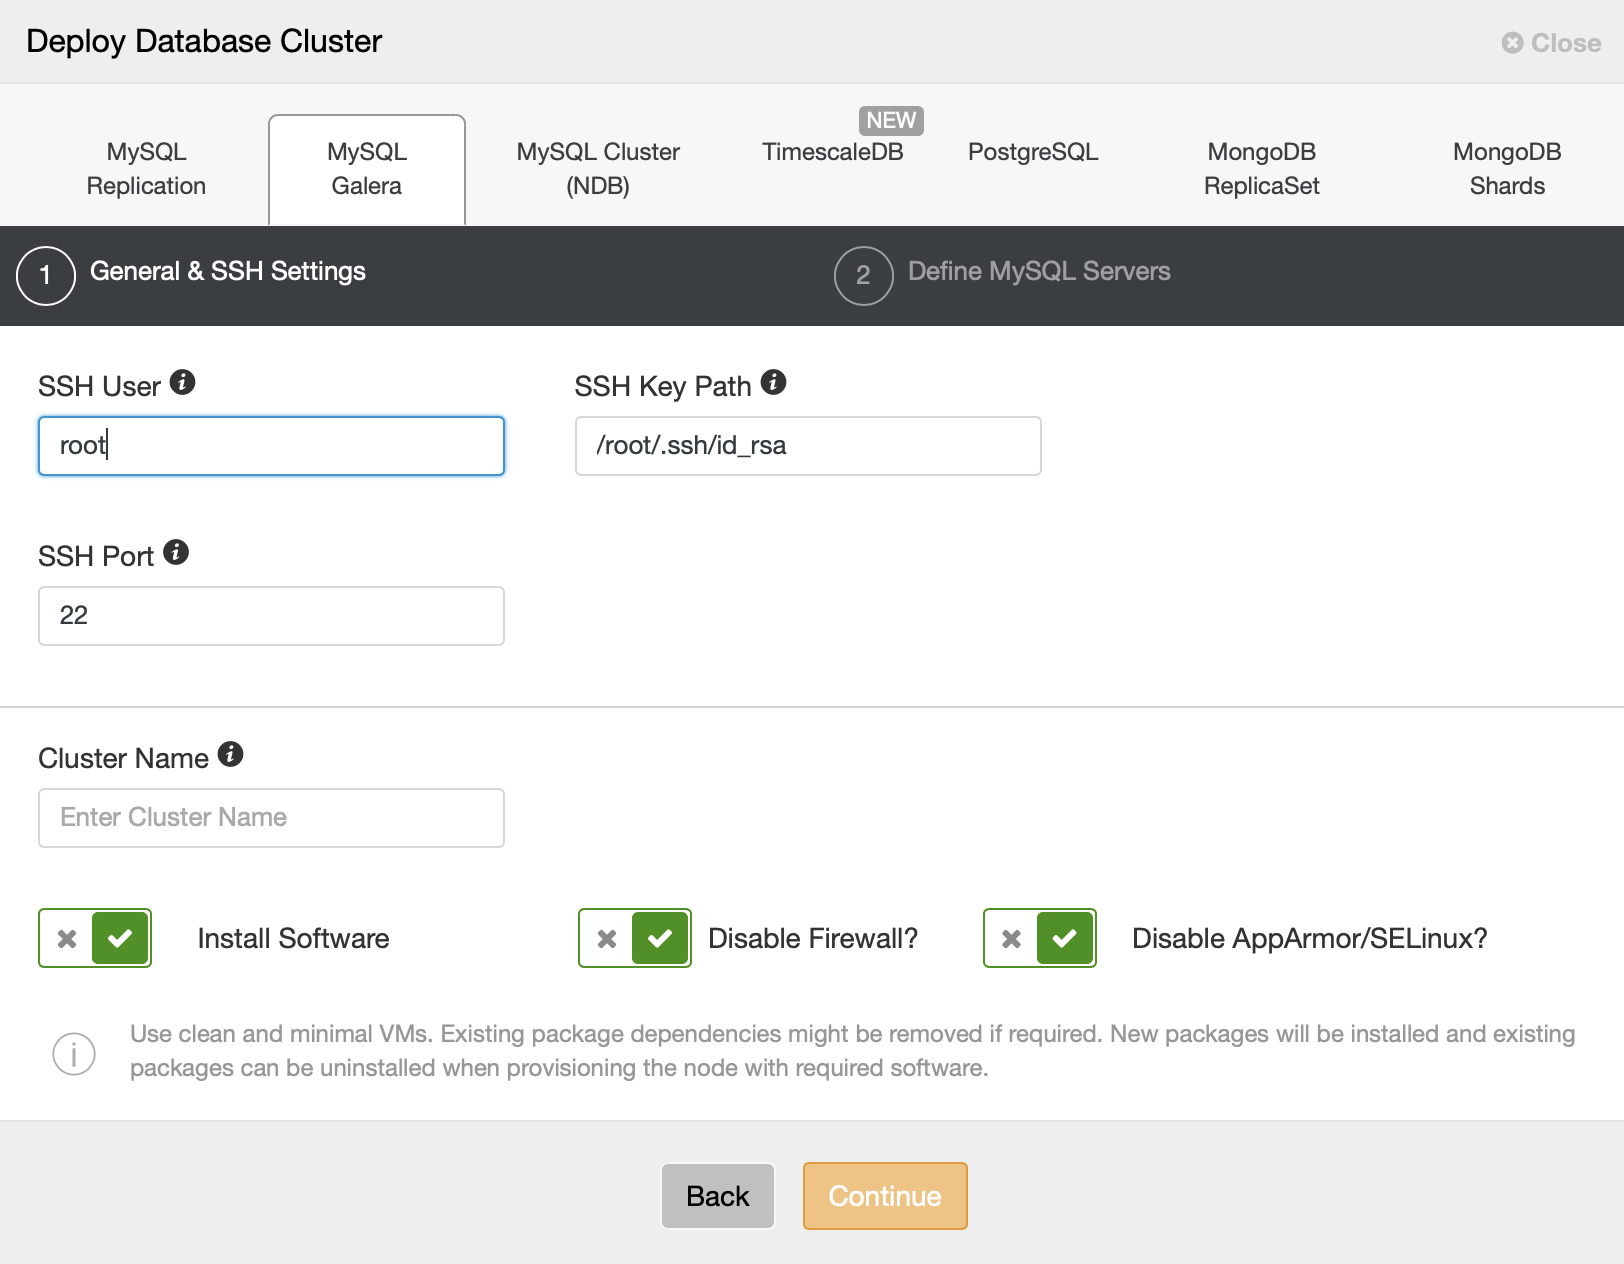
We will pick MySQL Replication as the cluster type and we need to provide connectivity details. It can be connection using root user or it can as well be a sudo user with or without a password.

In the next step, we have to make some decisions. We will use Percona Server for MySQL in its latest version. We also have to define a password for the root user on the nodes we will deploy.

In the final step we have to define a topology - we will go with what we proposed at the beginning - a master and three slaves.

ClusterControl will start the deployment - we can track it in the Activity tab, as shown on the screenshot above.

Once the deployment has completed, we can see the cluster in the cluster list:

Installing ProxySQL 2.0 Using ClusterControl

The next step will be to deploy ProxySQL. ClusterControl can do this for us.

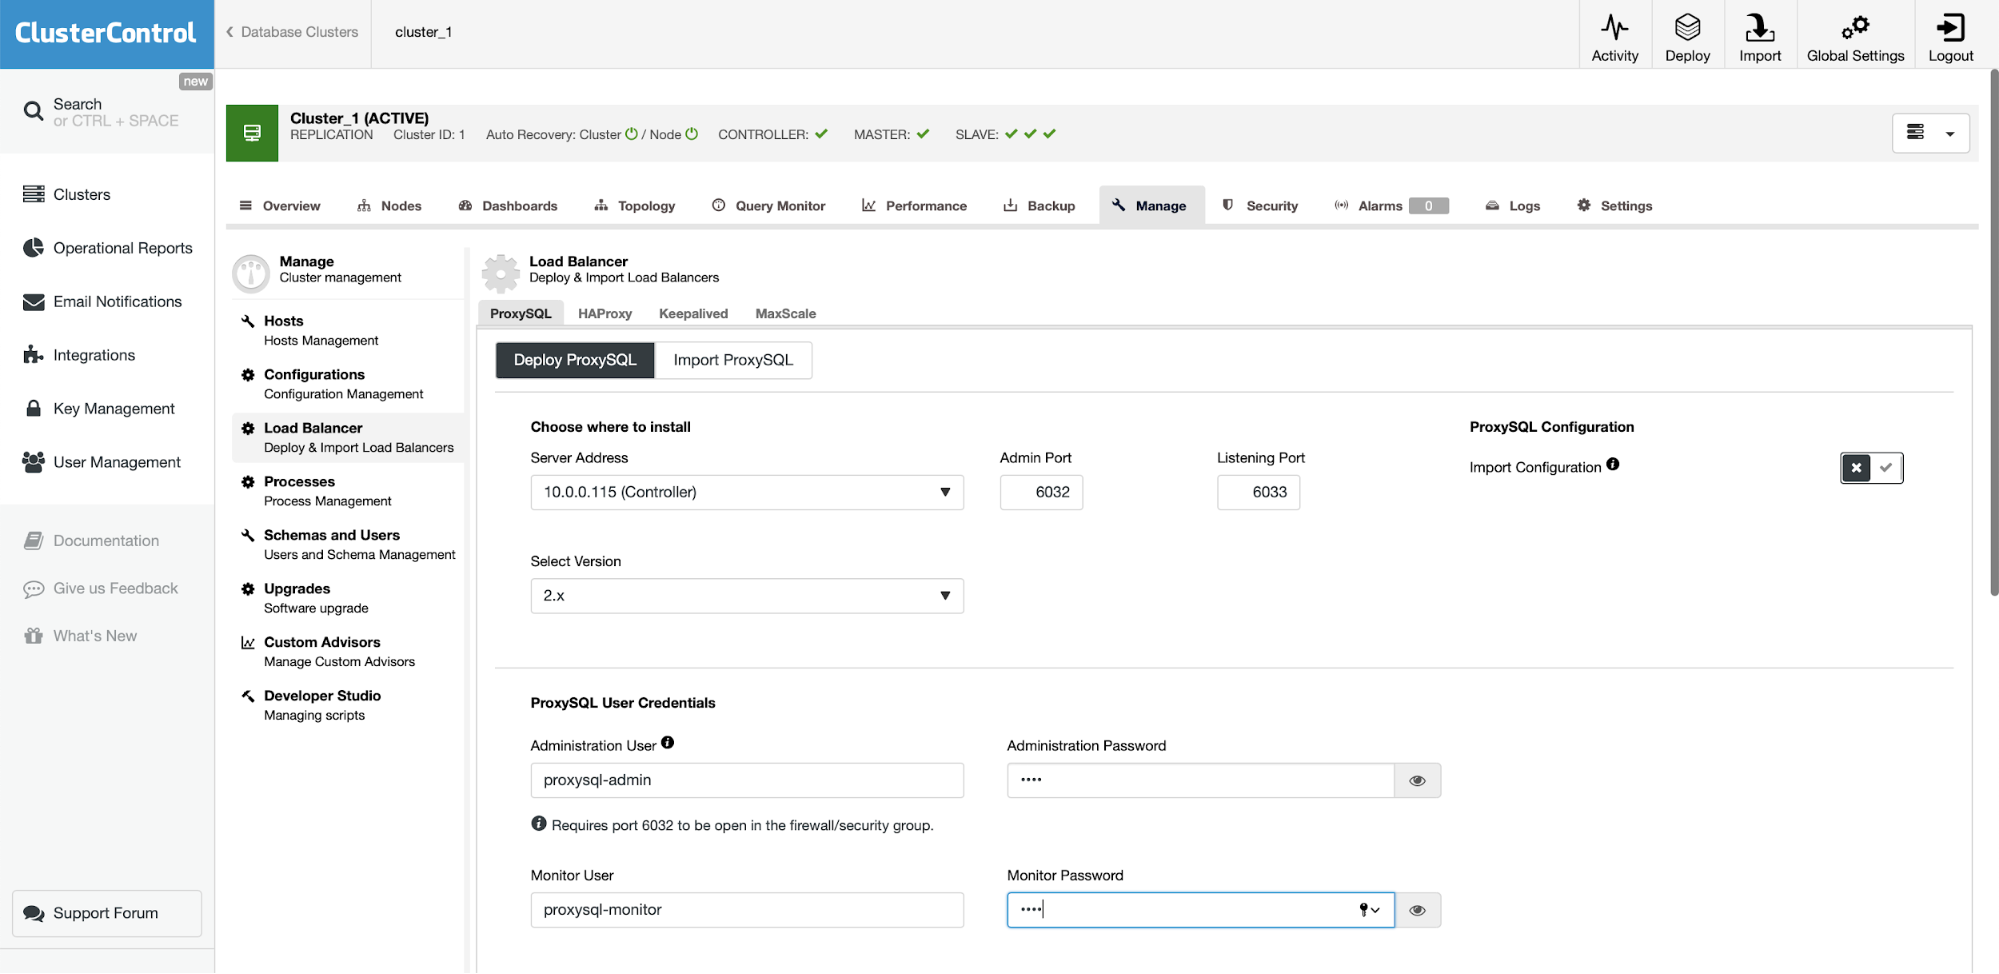
We can do this in Manage -> Load Balancer.

As we are just testing things, we are going to reuse the ClusterControl instance for ProxySQL and Sysbench. In real life you would probably want to use your “real” application server. If you can’t find it in the drop down, you can always write the server address (IP or hostname) by hand.

We also want to define credentials for monitoring and administrative user. We also double-checked that ProxySQL 2.0 will be deployed (you can always change it to 1.4.x if you need).

On the bottom part of the wizard we will define the user which will be created in both MySQL and ProxySQL. If you have an existing application, you probably want to use an existing user. If you use numerous users for your application you can always import the rest of them later, after ProxySQL will be deployed.

We want to ensure that all the MySQL instances will be configured in ProxySQL. We will use explicit transactions so we set the switch accordingly. This is all we needed to do - the rest is to click on the “Deploy ProxySQL” button and let ClusterControl does its thing.

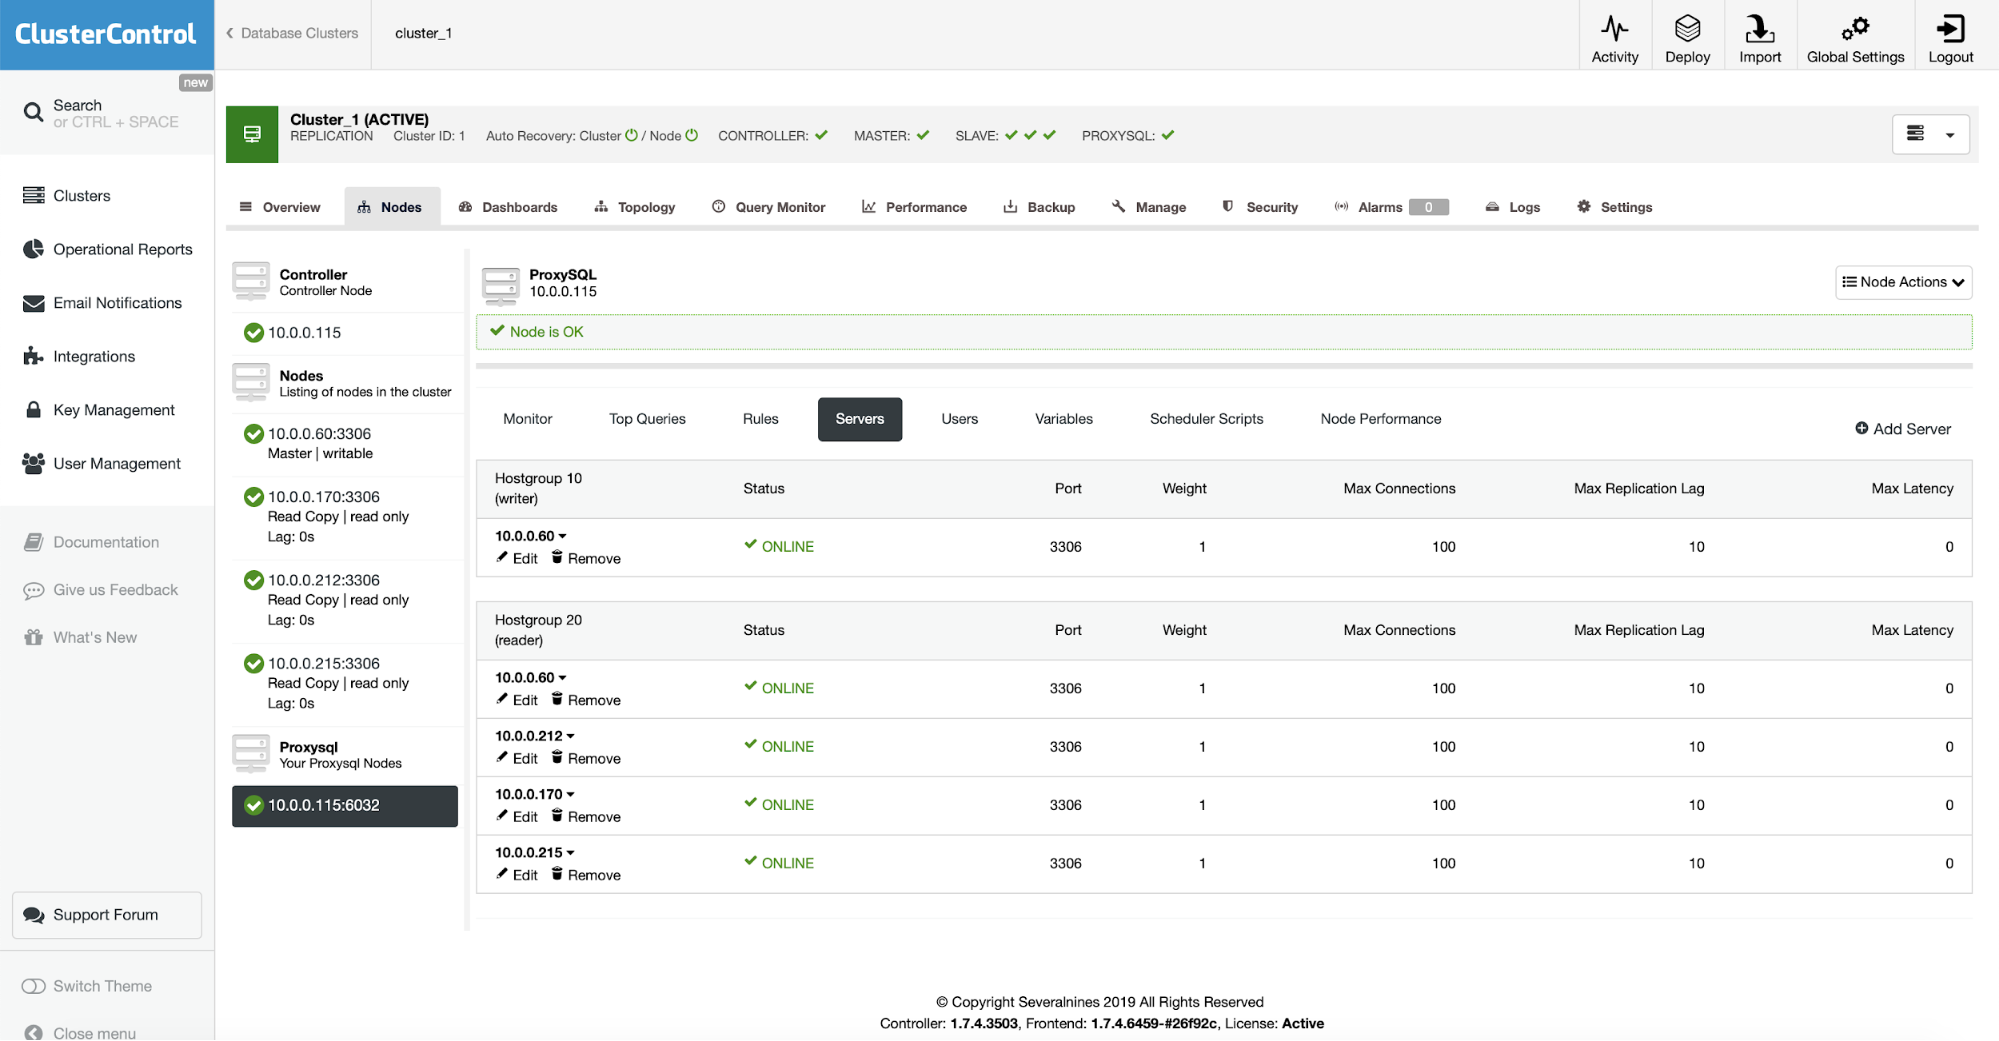
When the installation is completed, ProxySQL will show up on the list of nodes in the cluster. As you can see on the screenshot above, it already detected the topology and distributed nodes across reader and writer hostgroups.

Installing Sysbench

The final step will be to create our “application” by installing Sysbench. The process is fairly simple. At first we have to install prerequisites, libraries and tools required to compile Sysbench:

root@ip-10-0-0-115:~# apt install git automake libtool make libssl-dev pkg-config libmysqlclient-dev

Then we want to clone the sysbench repository:

root@ip-10-0-0-115:~# git clone https://github.com/akopytov/sysbench.git

Finally we want to compile and install Sysbench:

root@ip-10-0-0-115:~# cd sysbench/

root@ip-10-0-0-115:~/sysbench# ./autogen.sh && ./configure && make && make install

This is it, Sysbench has been installed. We now need to generate some data. For that, at first, we need to create a schema. We will connect to local ProxySQL and through it we will create a ‘sbtest’ schema on the master. Please note we used Unix socket for connection with ProxySQL.

root@ip-10-0-0-115:~/sysbench# mysql -S /tmp/proxysql.sock -u sbtest -psbtest

mysql> CREATE DATABASE sbtest;

Query OK, 1 row affected (0.01 sec)

Now we can use sysbench to populate the database with data. Again, we do use Unix socket for connection with the proxy:

root@ip-10-0-0-115:~# sysbench /root/sysbench/src/lua/oltp_read_write.lua --threads=4 --events=0 --time=3600 --mysql-socket=/tmp/proxysql.sock --mysql-user=sbtest --mysql-password=sbtest --tables=32 --report-interval=1 --skip-trx=on --table-size=100000 --db-ps-mode=disable prepare

Once the data is ready, we can proceed to our tests. 

Conclusion

In the second part of this blog, we will discuss ProxySQL’s handling of connections, failover and its settings that can help us to manage the master switch in a way that will be the least intrusive to the application.

Building a Hot Standby on Amazon AWS Using MariaDB Cluster

$
0
0

Galera Cluster 4.0 was first released as part of the MariaDB 10.4 and there are a lot of significant improvements in this version release. The most impressive feature in this release is the Streaming Replication which is designed to handle the following problems.

  • Problems with long transactions
  • Problems with large transactions
  • Problems with hot-spots in tables

In a previous blog, we deep-dove into the new Streaming Replication feature in a two-part series blog (Part 1 and Part 2). Part of this new feature in Galera 4.0 are new system tables which are very useful for querying and checking the Galera Cluster nodes and also the logs that have been processed in Streaming Replication. 

Also in previous blogs, we also showed you the Easy Way to Deploy a MySQL Galera Cluster on AWS and also how to Deploy a MySQL Galera Cluster 4.0 onto Amazon AWS EC2.

Percona hasn't released a GA for their Percona XtraDB Cluster (PXC) 8.0 yet as some features are still under development, such as the MySQL wsrep function WSREP_SYNC_WAIT_UPTO_GTID which looks to be not present yet (at least on PXC 8.0.15-5-27dev.4.2 version). Yet, when PXC 8.0 will be released, it will be packed with great features such as...

  • Improved resilient cluster
  • Cloud friendly cluster
  • improved packaging
  • Encryption support
  • Atomic DDL

While we're waiting for the release of PXC 8.0 GA, we'll cover in this blog how you can create a Hot Standby Node on Amazon AWS for Galera Cluster 4.0 using MariaDB.

What is a Hot Standby?

A hot standby is a common term in computing, especially on highly distributed systems. It's a method for redundancy in which one system runs simultaneously with an identical primary system. When failure happens on the primary node, the hot standby immediately takes over replacing the primary system. Data is mirrored to both systems in real time.

For database systems, a hot standby server is usually the second node after the primary master that is running on powerful resources (same as the master). This secondary node has to be as stable as the primary master to function correctly. 

It also serves as a data recovery node if the master node or the entire cluster goes down. The hot standby node will replace the failing node or cluster while continuously serving the demand from the clients.

In Galera Cluster, all servers part of the cluster can serve as a standby node. However, if the region or entire cluster goes down, how will you be able to cope up with this? Creating a standby node outside the specific region or network of your cluster is one option here. 

In the following section, we'll show you how to create a standby node on AWS EC2 using MariaDB.

Deploying a Hot Standby On Amazon AWS

Previously, we have showed you how you can create a Galera Cluster on AWS. You might want to read Deploying MySQL Galera Cluster 4.0 onto Amazon AWS EC2 in the case that you are new to Galera 4.0.

Deploying your hot standby node can be on another set of Galera Cluster which uses synchronous replication (check this blog Zero Downtime Network Migration With MySQL Galera Cluster Using Relay Node) or by deploying an asynchronous MySQL/MariaDB node. In this blog, we'll setup and deploy the hot standby node replicating asynchronously from one of the Galera nodes.

The Galera Cluster Setup

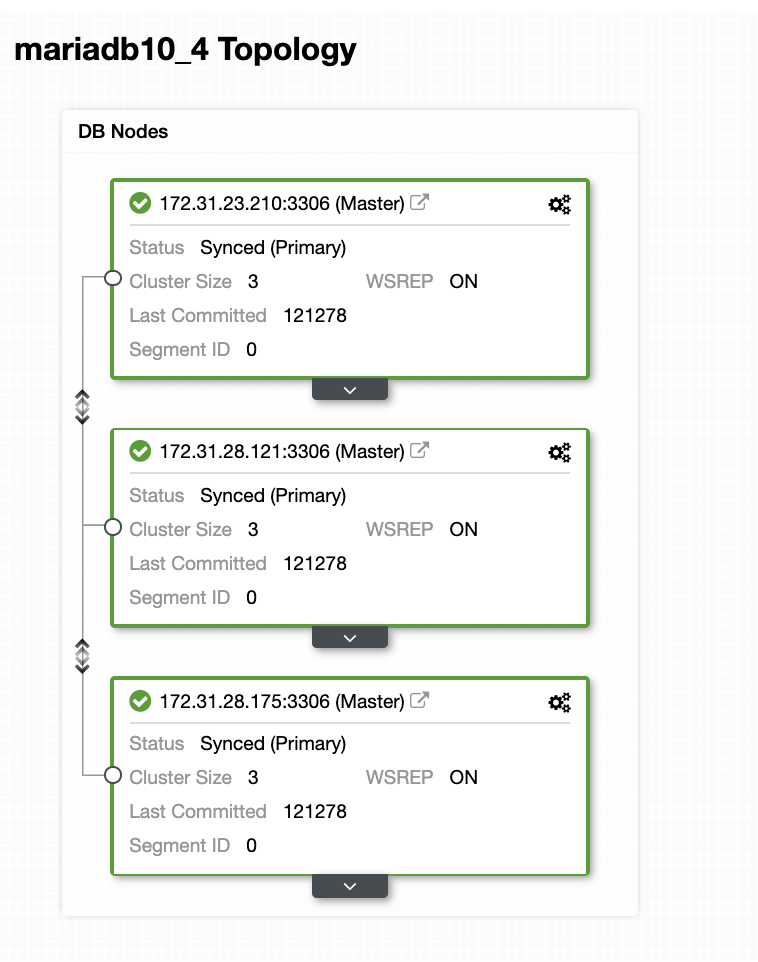
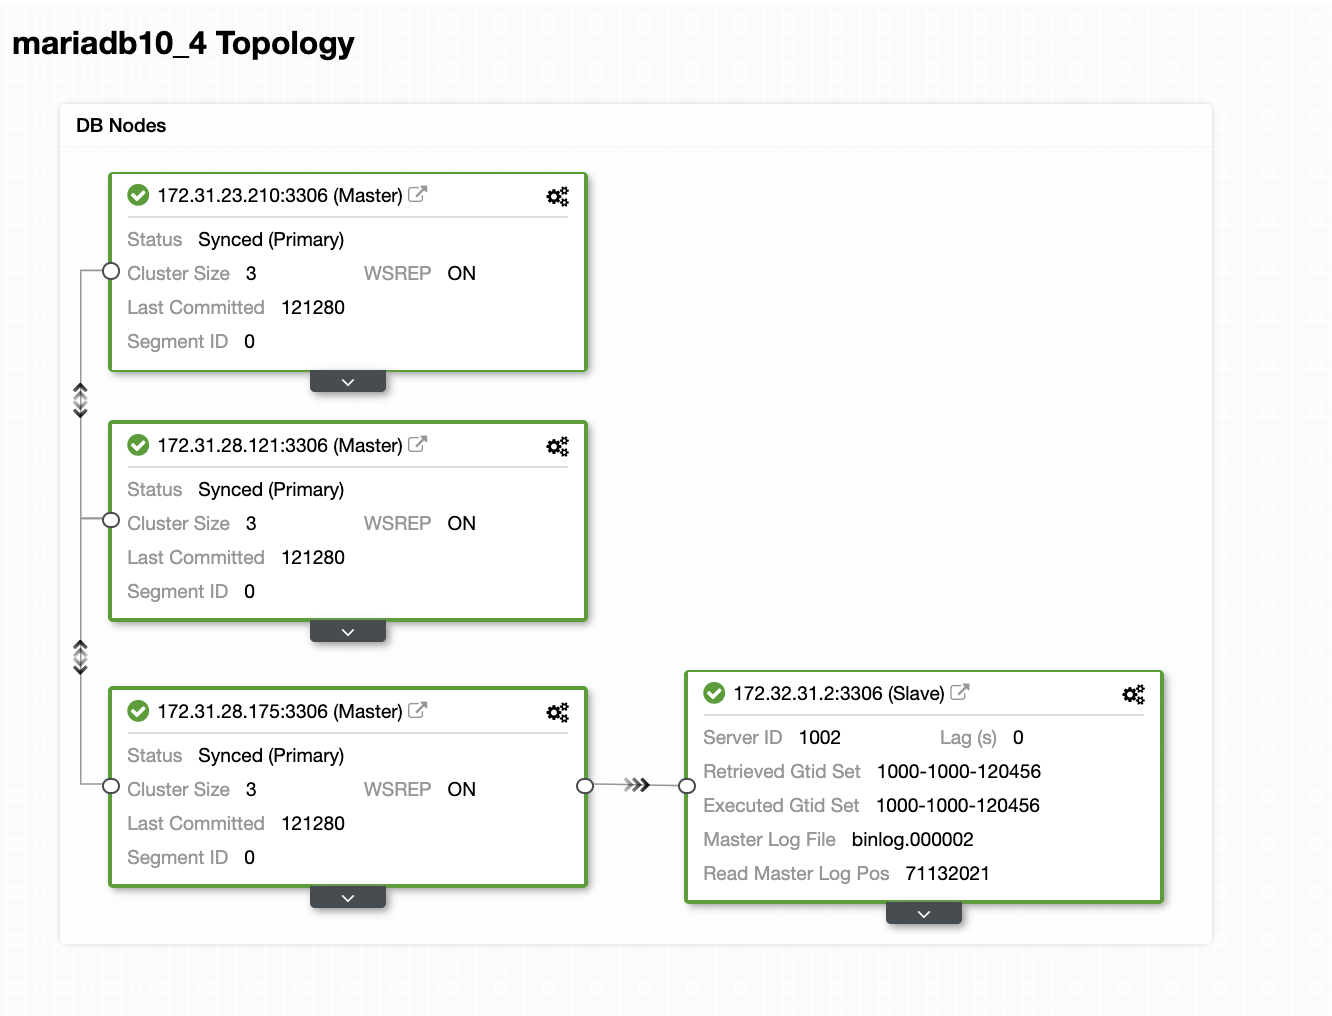
In this sample setup, we deployed 3-node cluster using MariaDB 10.4.8 version. This cluster is being deployed under US East (Ohio) region and the topology is shown below:

We'll use 172.31.26.175 server as the master for our asynchronous slave which will serve as the standby node.

Setting up your EC2 Instance for Hot Standby Node

In the AWS console, go to EC2 found under the Compute section and click Launch Instance to create an EC2 instance just like below.

We'll create this instance under the US West (Oregon) region. For your OS type, you can choose what server you like (I prefer Ubuntu 18.04) and choose the type of instance based on your preferred target type. For this example I will use t2.micro since it doesn't require any sophisticated setup and it's only for this sample deployment.

As we've mentioned earlier that its best that your hot standby node be located on a different region and not collocated or within the same region. So in case the regional data center goes down or suffers a network outage, your hot standby can be your failover target when things gone bad. 

Before we continue, in AWS, different regions will have its own Virtual Private Cloud (VPC) and its own network. In order to communicate with the Galera cluster nodes, we must first define a VPC Peering so the nodes can communicate within the Amazon infrastructure and do not need to go outside the network which just adds overhead and security concerns. 

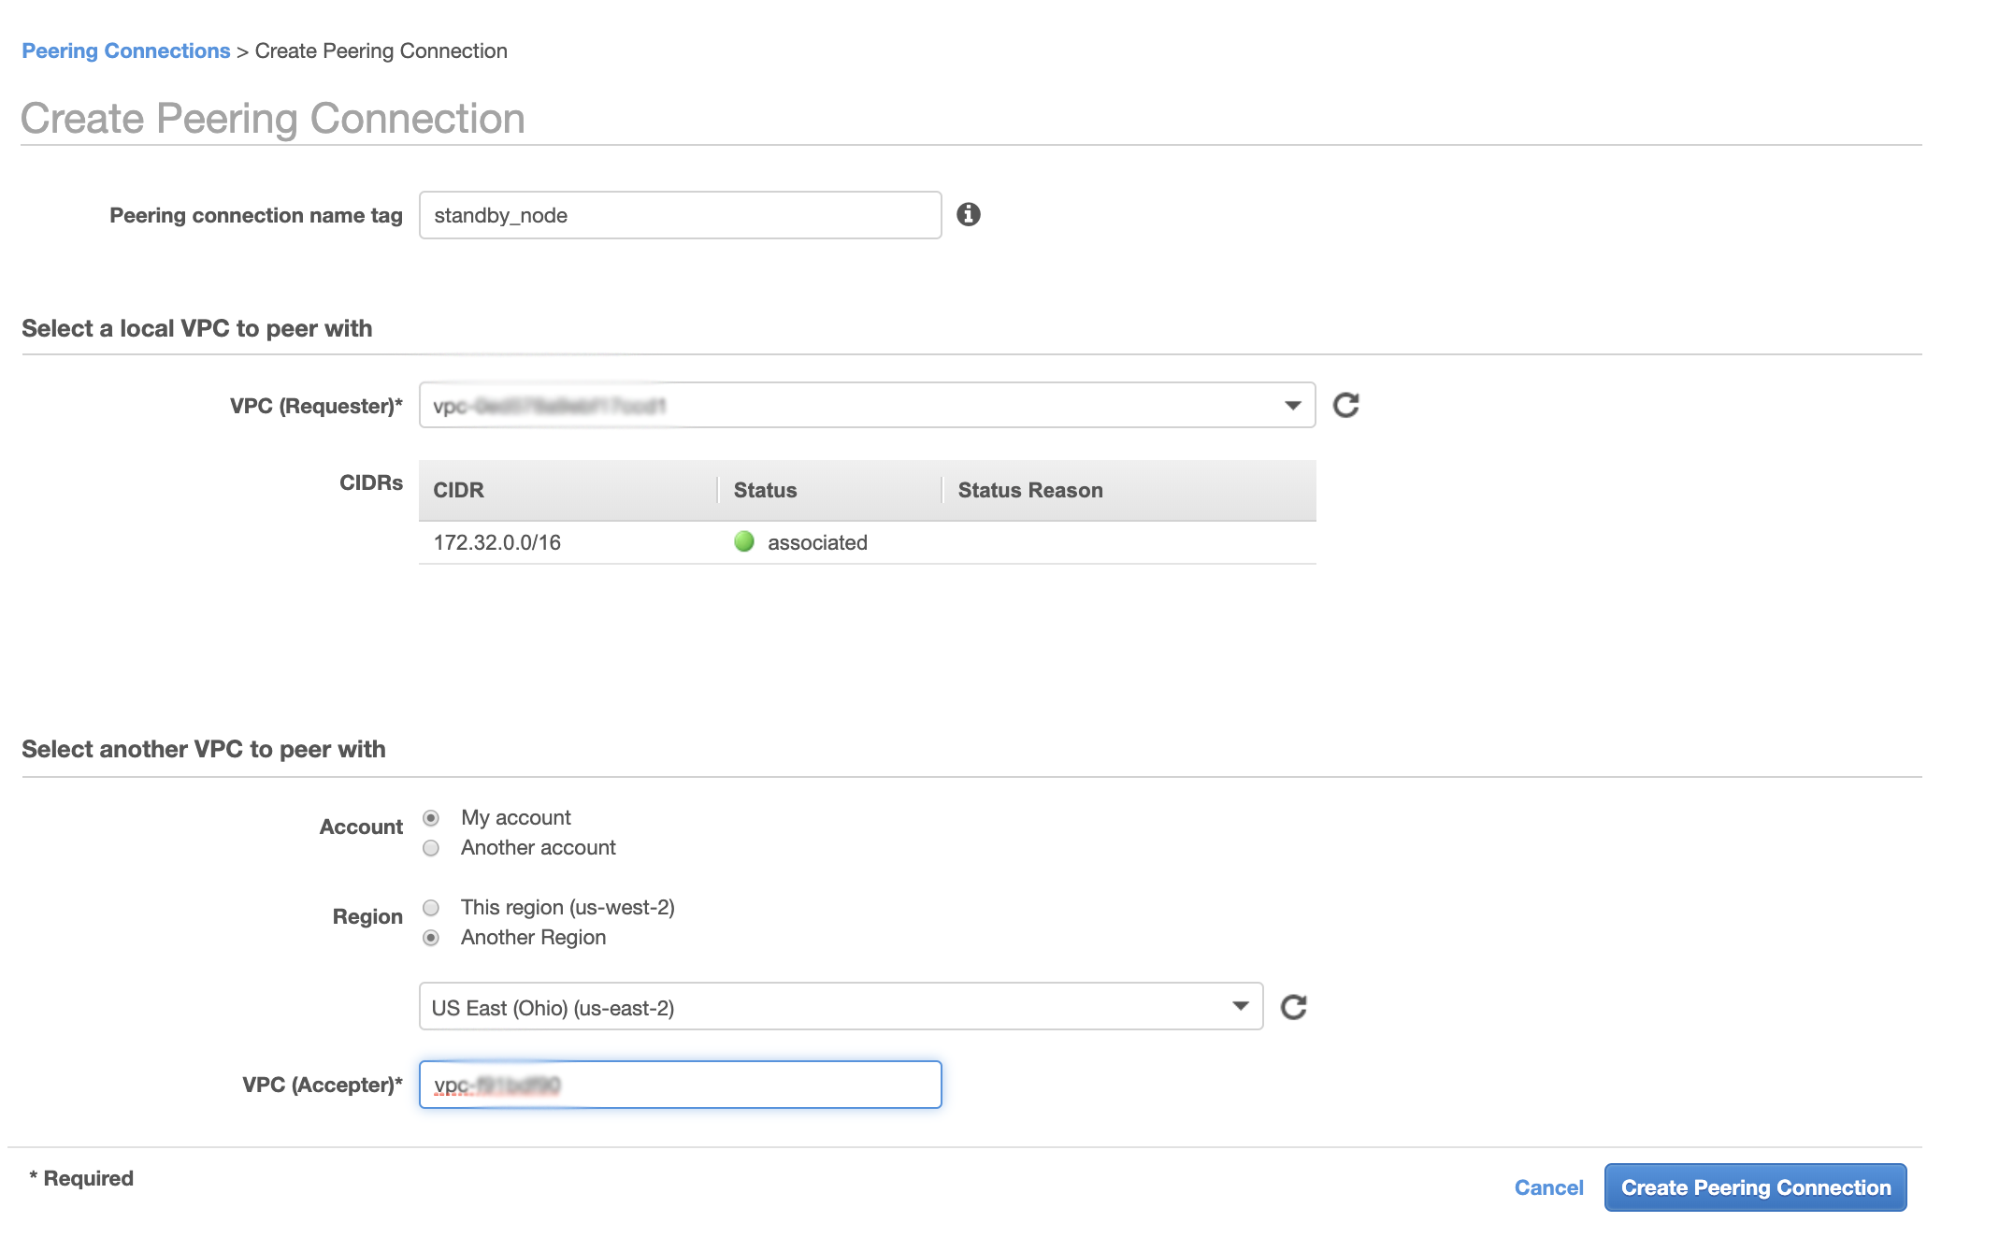
First, go to your VPC from where your hot standby node shall reside, then go to Peering Connections. Then you need to specify the VPC of your standby node and the Galera cluster VPC. In the example below, I have us-west-2 interconnecting to us-east-2.

Once created, you'll see an entry under your Peering Connections. However, you need to accept the request from the Galera cluster VPC, which is on us-east-2 in this example. See below,

Once accepted, do not forget to add the CIDR to the routing table. See this external blog VPC Peering about how to do it after VPC Peering.

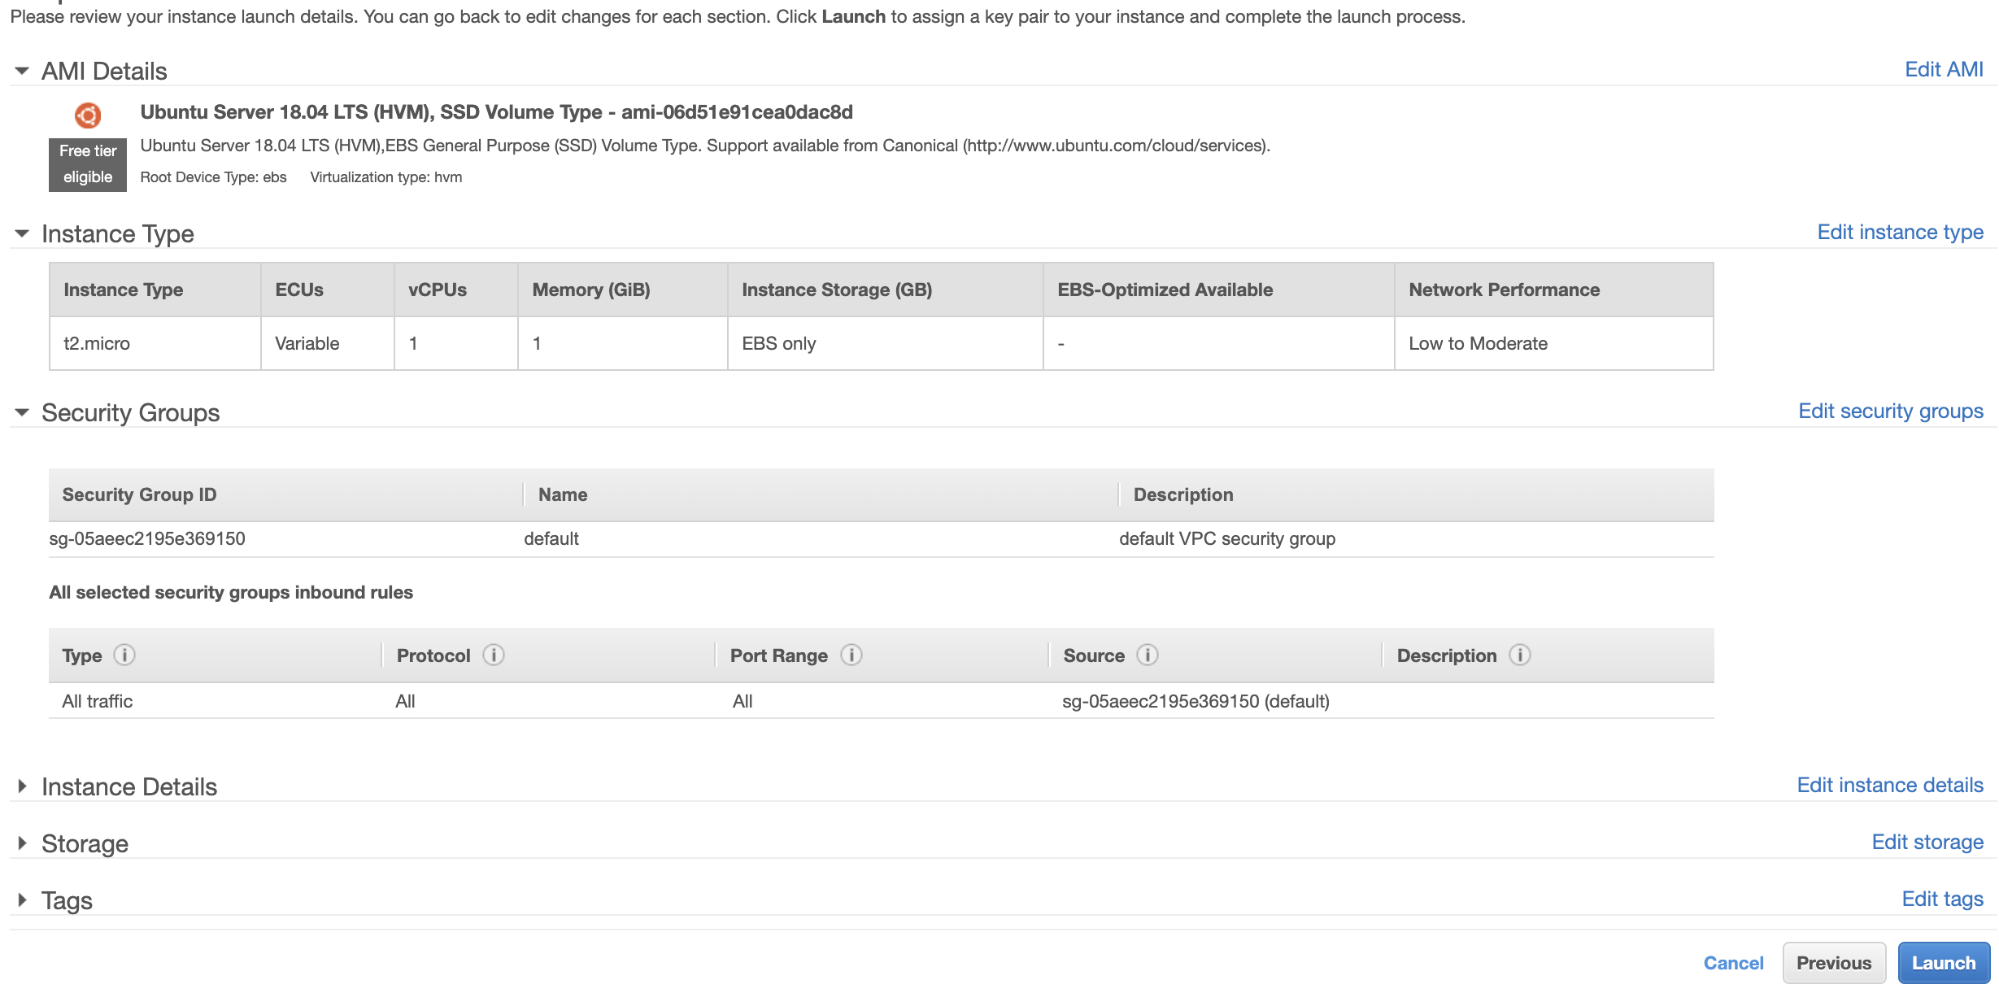
Now, let's go back and continue creating the EC2 node. Make sure your Security Group has the correct rules or required ports that needs to be opened. Check the firewall settings manual for more information about this. For this setup,  I just set All Traffic to be accepted since this is just a test. See below,

Make sure when creating your instance, you have set the correct VPC and you have defined your proper subnet. You can check this blog in case you need some help about that. 

Setting up the MariaDB Async Slave

Step One

First we need to setup the repository, add the repo keys and update the package list in the repository cache,

$ vi /etc/apt/sources.list.d/mariadb.list

$ apt-key adv --recv-keys --keyserver hkp://keyserver.ubuntu.com:80 0xF1656F24C74CD1D8

$ apt update

Step Two

Install the MariaDB packages and its required binaries

$ apt-get install mariadb-backup  mariadb-client mariadb-client-10.4 libmariadb3 libdbd-mysql-perl mariadb-client-core-10.4 mariadb-common mariadb-server-10.4 mariadb-server-core-10.4 mysql-common

Step Three

Now, let's take a backup using xbstream to transfer the files to the network from one of the nodes in our Galera Cluster.

## Wipe out the datadir of the newly fresh installed MySQL in your hot standby node.

$ systemctl stop mariadb

$ rm -rf /var/lib/mysql/*

## Then on the hot standby node, run this on the terminal,

$ socat -u tcp-listen:9999,reuseaddr stdout 2>/tmp/netcat.log | mbstream -x -C /var/lib/mysql

## Then on the target master, i.e. one of the nodes in your Galera Cluster (which is the node 172.31.28.175 in this example), run this on the terminal,

$ mariabackup  --backup --target-dir=/tmp --stream=xbstream | socat - TCP4:172.32.31.2:9999

where 172.32.31.2 is the IP of the host standby node.

Step Four

Prepare your MySQL configuration file. Since this is in Ubuntu, I am editing the file in /etc/mysql/my.cnf and with the following sample my.cnf taken from our ClusterControl template,

[MYSQLD]

user=mysql

basedir=/usr/

datadir=/var/lib/mysql

socket=/var/lib/mysql/mysql.sock

pid_file=/var/lib/mysql/mysql.pid

port=3306

log_error=/var/log/mysql/mysqld.log

log_warnings=2

# log_output = FILE


#Slow logging    

slow_query_log_file=/var/log/mysql/mysql-slow.log

long_query_time=2

slow_query_log=OFF

log_queries_not_using_indexes=OFF


### INNODB OPTIONS

innodb_buffer_pool_size=245M

innodb_flush_log_at_trx_commit=2

innodb_file_per_table=1

innodb_data_file_path = ibdata1:100M:autoextend

## You may want to tune the below depending on number of cores and disk sub

innodb_read_io_threads=4

innodb_write_io_threads=4

innodb_doublewrite=1

innodb_log_file_size=64M

innodb_log_buffer_size=16M

innodb_buffer_pool_instances=1

innodb_log_files_in_group=2

innodb_thread_concurrency=0

# innodb_file_format = barracuda

innodb_flush_method = O_DIRECT

innodb_rollback_on_timeout=ON

# innodb_locks_unsafe_for_binlog = 1

innodb_autoinc_lock_mode=2

## avoid statistics update when doing e.g show tables

innodb_stats_on_metadata=0

default_storage_engine=innodb


# CHARACTER SET

# collation_server = utf8_unicode_ci

# init_connect = 'SET NAMES utf8'

# character_set_server = utf8


# REPLICATION SPECIFIC

server_id=1002

binlog_format=ROW

log_bin=binlog

log_slave_updates=1

relay_log=relay-bin

expire_logs_days=7

read_only=ON

report_host=172.31.29.72

gtid_ignore_duplicates=ON

gtid_strict_mode=ON


# OTHER THINGS, BUFFERS ETC

key_buffer_size = 24M

tmp_table_size = 64M

max_heap_table_size = 64M

max_allowed_packet = 512M

# sort_buffer_size = 256K

# read_buffer_size = 256K

# read_rnd_buffer_size = 512K

# myisam_sort_buffer_size = 8M

skip_name_resolve

memlock=0

sysdate_is_now=1

max_connections=500

thread_cache_size=512

query_cache_type = 0

query_cache_size = 0

table_open_cache=1024

lower_case_table_names=0

# 5.6 backwards compatibility (FIXME)

# explicit_defaults_for_timestamp = 1


performance_schema = OFF

performance-schema-max-mutex-classes = 0

performance-schema-max-mutex-instances = 0


[MYSQL]

socket=/var/lib/mysql/mysql.sock

# default_character_set = utf8

[client]

socket=/var/lib/mysql/mysql.sock

# default_character_set = utf8

[mysqldump]

socket=/var/lib/mysql/mysql.sock

max_allowed_packet = 512M

# default_character_set = utf8


[xtrabackup]


[MYSQLD_SAFE]

# log_error = /var/log/mysqld.log

basedir=/usr/

# datadir = /var/lib/mysql

Of course, you can change this according to your setup and requirements.

Step Five

Prepare the backup from step #3 i.e. the finish backup that is now in the hot standby node by running the command below,

$ mariabackup --prepare --target-dir=/var/lib/mysql

Step Six

Set the ownership of the datadir in the hot standby node,

$ chown -R mysql.mysql /var/lib/mysql

Step Seven

Now, start the MariaDB instance

$  systemctl start mariadb

Step Eight

Lastly, we need to setup the asynchronous replication,

## Create the replication user on the master node, i.e. the node in the Galera cluster

MariaDB [(none)]> CREATE USER 'cmon_replication'@'172.32.31.2' IDENTIFIED BY 'PahqTuS1uRIWYKIN';

Query OK, 0 rows affected (0.866 sec)

MariaDB [(none)]> GRANT REPLICATION SLAVE, REPLICATION CLIENT ON *.* TO 'cmon_replication'@'172.32.31.2';

Query OK, 0 rows affected (0.127 sec)

## Get the GTID slave position from xtrabackup_binlog_info as follows,

$  cat /var/lib/mysql/xtrabackup_binlog_info

binlog.000002   71131632 1000-1000-120454

##  Then setup the slave replication as follows,

MariaDB [(none)]> SET GLOBAL gtid_slave_pos='1000-1000-120454';

Query OK, 0 rows affected (0.053 sec)

MariaDB [(none)]> CHANGE MASTER TO MASTER_HOST='172.31.28.175', MASTER_USER='cmon_replication', master_password='PahqTuS1uRIWYKIN', MASTER_USE_GTID = slave_pos;

## Now, check the slave status,

MariaDB [(none)]> show slave status \G

*************************** 1. row ***************************

                Slave_IO_State: Waiting for master to send event

                   Master_Host: 172.31.28.175

                   Master_User: cmon_replication

                   Master_Port: 3306

                 Connect_Retry: 60

               Master_Log_File: 

           Read_Master_Log_Pos: 4

                Relay_Log_File: relay-bin.000001

                 Relay_Log_Pos: 4

         Relay_Master_Log_File: 

              Slave_IO_Running: Yes

             Slave_SQL_Running: Yes

               Replicate_Do_DB: 

           Replicate_Ignore_DB: 

            Replicate_Do_Table: 

        Replicate_Ignore_Table: 

       Replicate_Wild_Do_Table: 

   Replicate_Wild_Ignore_Table: 

                    Last_Errno: 0

                    Last_Error: 

                  Skip_Counter: 0

           Exec_Master_Log_Pos: 4

               Relay_Log_Space: 256

               Until_Condition: None

                Until_Log_File: 

                 Until_Log_Pos: 0

            Master_SSL_Allowed: No

            Master_SSL_CA_File: 

            Master_SSL_CA_Path: 

               Master_SSL_Cert: 

             Master_SSL_Cipher: 

                Master_SSL_Key: 

         Seconds_Behind_Master: 0

 Master_SSL_Verify_Server_Cert: No

                 Last_IO_Errno: 0

                 Last_IO_Error: 

                Last_SQL_Errno: 0

                Last_SQL_Error: 

   Replicate_Ignore_Server_Ids: 

              Master_Server_Id: 1000

                Master_SSL_Crl: 

            Master_SSL_Crlpath: 

                    Using_Gtid: Slave_Pos

                   Gtid_IO_Pos: 1000-1000-120454

       Replicate_Do_Domain_Ids: 

   Replicate_Ignore_Domain_Ids: 

                 Parallel_Mode: conservative

                     SQL_Delay: 0

           SQL_Remaining_Delay: NULL

       Slave_SQL_Running_State: Slave has read all relay log; waiting for the slave I/O thread to update it

              Slave_DDL_Groups: 0

Slave_Non_Transactional_Groups: 0

    Slave_Transactional_Groups: 0

1 row in set (0.000 sec)

Adding Your Hot Standby Node To ClusterControl

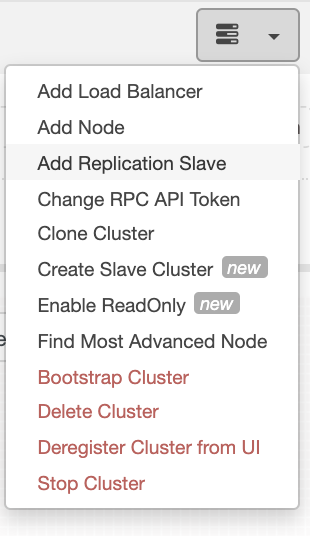
If you are using ClusterControl, it's easy to monitor your database server's health. To add this as a slave, select the Galera node cluster you have then go to the selection button as shown below to Add Replication Slave:

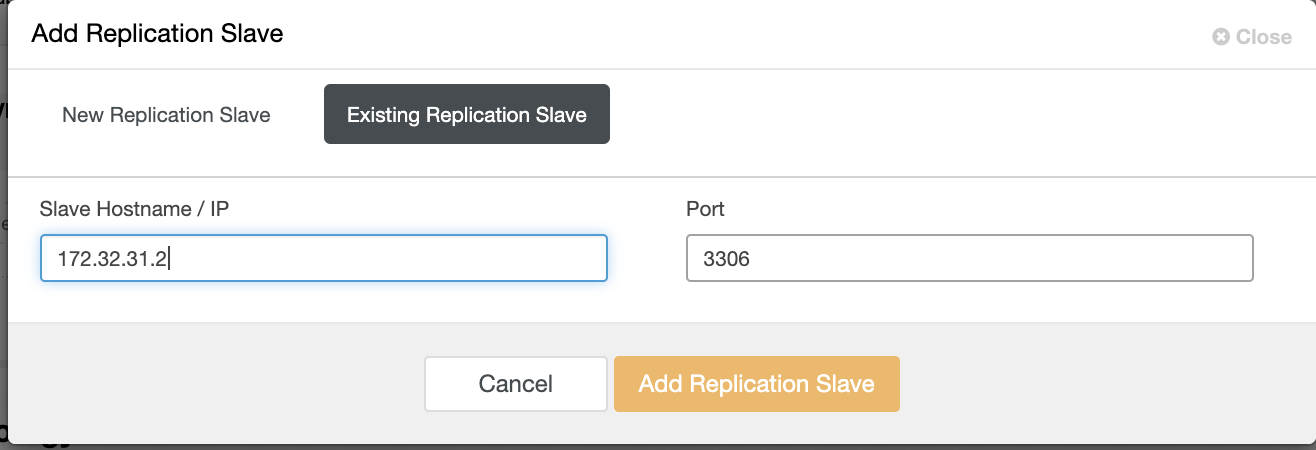
Click Add Replication Slave and choose adding an existing slave just like below,

Our topology looks promising.

As you might notice, our node 172.32.31.2 serving as our hot standby node has a different CIDR which prefixes as 172.32.% us-west-2 (Oregon) while the other nodes are of 172.31.% located on us-east-2 (Ohio). They're totally on different region, so in case network failure occurs on your Galera nodes, you can failover to your hot standby node.

Conclusion

Building a Hot Standby on Amazon AWS is easy and straightforward. All you need is to determine your capacity requirements and your networking topology, security, and protocols that need to be setup. 

Using VPC Peering helps speed up inter-communication between different region without going to the public internet, so the connection stays within the Amazon network infrastructure. 

Using asynchronous replication with one slave is, of course, not enough, but this blog serves as the foundation on how you can initiate this. You can now easily create another cluster where the asynchronous slave is replicating and create another series of Galera Clusters serving as your Disaster Recovery nodes, or you can also use gmcast.segment variable in Galera to replicate synchronously just like what we have on this blog

Tips for Migrating from Proprietary to Open Source Databases

$
0
0

Back in the day proprietary databases were the only acceptable options. 

“No one ever got fired for buying from Oracle/Microsoft/IBM” was the saying. 

Huge, monolithic databases used for every single purpose. Paid support - that’s how the database landscape looked like in the 90s and early 00s. Sure, open source databases were there but they were treated like a “toy database,” suitable for a small website, a blog maybe, or a very small e-shop. No one sane would use them for anything critical. 

Things have changed over time and open source databases have matured. More and more are being created every year. We now see specialization, allowing users to pick the best option for given workload - time series, analytical, columnstore, NoSQL, relational, key-value  - you can pick whatever databases you need and, usually, there are numerous options to pick from. This leads to open source being more and more popular in the database world. Companies are now looking at their bills from their proprietary database vendor and wonder if they can reduce it a bit by an adopting free open source database.

As usual, there are pros and cons. What are things you may want to consider before implementing open source database? In this blog post we will share some tips you may want to keep in mind when planning to migrate to open source databases.

Start Small and Expand

If your organisation does not use open source databases, most likely it doesn’t have experience in managing them either. While doable through external consultants, it is probably not a good idea to migrate your whole environment into open source databases. 

The better approach, instead, would be to start with small projects. Maybe you need to build some sort of an internal tool or website, maybe some sort of a monitoring tool - that’s a great opportunity to use open source databases and get the experience of using it in real world environments. This will let you to learn the ins and outs of a database - how to diagnose it, how to track its performance, how to tune it to improve its performance. 

On top of that you would learn more about the high availability options and implementations. Working with it also helps to understand the differences between the proprietary database that you use and the open source databases that you implemented for smaller projects. In time you should see the open source database footprint in your organization increased significantly along with the experience of your teams. 

At some point, after collecting enough experience to run the open source databases, you may decide to pull the lever and start a migration project. Another, also quite likely option, is that you would be gradually moving your operations to open source databases on project-by-project basis. Eventually your existing applications that use proprietary RDBMS will become deprecated and, eventually, replaced by new iteration of the software, which rely on open source databases.

Pick the Right Database for the Job

We already mentioned that open source databases are, typically, quite specialised. You can pick a datastore suitable for different uses - time series, document store, key-value store, columnar store, text search. This, combined with the previous tip, lets you pick exactly the type of a database that your small project requires. Let’s say you want to build a monitoring stack for your environment. 

You may want to look into time series databases like Prometheus or TimeScaleDB to power your monitoring application. Maybe you want to implement some sort of analytical/big data solutions. You would have to design some sort of an ETL process to extract the data from your main RDBMS and load it into an open source solution. There are numerous options to be used as a datastore. Depending on the requirements and data you can choose from a wide variety of databases, for example Clickhouse, Cassandra, Hive and many more.

What about moving some parts of the application from the proprietary RDBMS to an open source solution?

There are options for that as well. Datastores like PostgreSQL or MariaDB have a great deal of features related to easy the migration from datastores like Oracle. They do come with, for example, support for PL/SQL and other SQL features available for Oracle. This is a great help - less code has to be converted alongside with the migration from Oracle to other databases, it is more likely that your stored procedures and functions also will work mostly out of the box and you won’t have to spend a significant amount of time to rewrite, test and debug code that represents a core logic of your application.

You should also not forget about the resources you already have in your team. Maybe someone has some experience in more popular open source datastores? If those match your requirements and fit in your environment, you might be able to utilize existing knowledge in your team and easy transition into the open source world.

Consider Getting Support

Migrating into datastores that you don’t have too much experience with is always tricky. Even if you proceed with small steps you still may be caught by surprise behavior, unexpected situation, bugs or even just operational situations that you are not familiar with. 

Open source databases typically have a great community support - email lists, forums, Slack channels. Usually, when you ask, someone will attempt to help you. This may not be enough in some cases. If that’s the case, you should look for a paid support. There are numerous ways how this can be achieved. 

First of all, not all open source projects are made equal. Larger projects, like PostgreSQL or MySQL may have developed an ecosystem of consulting companies that hire experts who can do consulting for you. If such option, for whatever reason, is not available or feasible, you can always reach out to the project maintainers.

It is very common that the company, which develops the datastore, will be happy to help for a price.

Independent consulting companies have a significant advantage - they are independent and they will propose a solution based on their experience, not based on the datastore and tools they develop. Vendors, well, they will usually push their own solutions and environment. On the other hand, vendors are quite interested in increasing the adoption of their datastore. If you are migrating from a proprietary datastore, they may have been in that situation several times before thus they should be able to provide you with good practices, help you to design the migration process and so on. For an inexperienced company access to the experts in the field of migration might be a great asset.

You may find access to external support useful not only at the migration phase. Dealing with new datastore is always tricky and learning all of the aspects of the operations are time consuming. Even after migration you may still benefit from having someone you can call, ask and, what's most important, learn from. Trainings, remote DBA, all of those are common options in the world of open source databases, especially for those larger, more established projects.

Find a System or Tool to Help

Open source databases come with a variety of tools, some more or less complex. Some adds functionality (high availability, backups, monitoring), some are designed to make the database management easier. 

It is important to leverage them (consulting contracts may be useful here to introduce you to the most important tooling for the open source datastore of your choice) as they can significantly increase your operational velocity and the performance and stability of the whole setup. 

Some tools are free, some require a license to operate, you should look into the pool and pick what suits you the most. We are talking here about load balancers, tools to manage replication topology, Virtual IP management tools, clustering solutions, more or less dedicated monitoring and observability platforms that may track anything starting from typical database performance metrics through giving smart predictions based on the data to specialized analysis of the query performance. 

The open source world is where such tools thrive - this also has pros and cons. It’s easy to find “A” tool, it’s hard to find “THE” tool. You can find numerous projects on GitHub, everyone doing almost the same as others. Which one to choose is the hard part. That’s why, ideally you would have a helping hand in either a support contract or you can also rely on management platforms that will help you to manage multiple aspects of the operations on open source databases, including helping you to standardize and pick the correct tools for that.

There are also platforms like ClusterControl, which was designed to help non-experienced people fully grasp the power of open source databases. ClusterControl supports multiple different types of open source datastores: MySQL and its flavors, PostgreSQL, TimeScaleDB or MongoDB. It provides unified user interface to access management functions for those datastores, making it easy to deploy and manage them. Instead of spending time testing different tools and solutions, using ClusterControl you can easily deploy highly available environment, schedule backups and keep track of metrics in the system. 

Tools like ClusterControl reduce the load on your team, increasing their ability to understand what is happening in the database they are not as familiar with as they would have wanted.

Take Your Time

What’s good to keep in mind is that there is no need to rush. The stability of your environment and the well-being of your users is paramount. Take your time to run the tests, verify all the aspects of your application. Verify that you have proper high availability and disaster recovery processes in place. 

Only when you are 100% sure you are good to switch, it’d be time to pull the lever and make the switch to open source databases.


Announcing ClusterControl 1.7.4: Cluster-to-Cluster Replication - Ultimate Disaster Recovery

$
0
0

We’re excited to announce the 1.7.4 release of ClusterControl - the only database management system you’ll ever need to take control of your open source database infrastructure. 

In this release we launch a new function that could be the ultimate way to minimize RTO as part of your disaster recovery strategy. Cluster-to-Cluster Replication for MySQL and PostgreSQL lets you build-out a clone of your entire database infrastructure and deploy it to a secondary data center, while keeping both synced. This ensures you always have an available up-to-date database setup ready to switch-over to should disaster strike.  

In addition we are also announcing support for the new MariaDB 10.4 / Galera Cluster 4.x as well as support for ProxySQL 2.0, the latest release from the industry leading MySQL load balancer.

Lastly, we continue our commitment to PostgreSQL by releasing new user management functions, giving you complete control over who can access or administer your postgres setup.

Release Highlights

Cluster-to-Cluster Database Replication

  • Asynchronous MySQL Replication Between MySQL Galera Clusters.
  • Streaming Replication Between PostgreSQL Clusters.
  • Ability to Build Clusters from a Backup or by Streaming Directly from a Master Cluster.

Added Support for MariaDB 10.4 & Galera Cluster 4.x

  • Deployment, Configuration, Monitoring and Management of the Newest Version of Galera Cluster Technology, initially released by MariaDB
    • New Streaming Replication Ability
    • New Support for Dealing with Long Running & Large Transactions
    • New Backup Locks for SST

Added Support for ProxySQL 2.0

  • Deployment and Configuration of the Newest Version of the Best MySQL Load Balancer on the Market
    • Native Support for Galera Cluster
    • Enables Causal Reads Using GTID
    • New Support for SSL Frontend Connections
    • Query Caching Improvements

New User Management Functions for PostgreSQL Clusters

  • Take full control of who is able to access your PostgreSQL database.
 

View Release Details and Resources

Release Details

Cluster-to-Cluster Replication

Either streaming from your master or built from a backup, the new Cluster-to-Cluster Replication function in ClusterControl let’s you create a complete disaster recovery database system into another data center; which you can then easily failover to should something go wrong, during maintenance, or during a major outage.

In addition to disaster recovery, this function also allows you to create a copy of your database infrastructure (in just a couple of clicks) which you can use to test upgrades, patches, or to try some database performance enhancements.

You can also use this function to deploy an analytics or reporting setup, allowing you to separate your reporting load from your OLTP traffic.

Cluster to Cluster Replication

PostgreSQL User Management

You now have the ability to add or remove user access to your PostgreSQL setup. With the simple interface, you can specify specific permissions or restrictions at the individual level. It also provides a view of all defined users who have access to the database, with their respective permissions. For tips on best practices around PostgreSQL user management you can check out this blog.

MariaDB 10.4 / Galera Cluster 4.x Support

In an effort to boost performance for long running or large transactions, MariaDB & Codership have partnered to add Streaming Replication to the new MariaDB Cluster 10.4. This addition solves many challenges that this technology has previously experienced with these types of transactions. There are three new system tables added to the release to support this new function as well as new synchronisation functions.  You can read more about what’s included in this release here.

Deploy MariaDB Cluster 10.4
 

An Overview of Cluster-to-Cluster Replication

$
0
0

Nowadays, it’s pretty common to have a database replicated in another server/datacenter, and it’s also a must in some cases. There are different reasons to replicate your databases to a totally separate environment. 

  • Migrate to another datacenter.
  • Upgrade (hardware/software) requirements.
  • Maintain a fully synced operational system in a Disaster Recovery (DR) site that can take over at any time
  • Keep a slave database as part of a lower cost DR Plan.
  • For geo-location requirements (data needs to be locally in a specific country).
  • Have a testing environment.
  • Troubleshooting purpose.
  • Reporting database.

And, there are different ways to perform this replication task:

  • Backup/Restore: Backing up a production database and restoring it in a new server/environment is the classic way to do this, but it is also an old-fashioned way as you won’t keep your data up-to-date and you need to wait for each restoring process if you need some recent data. If you have a cluster (master-slave, multi-master), and if you want to recreate it, you should restore the initial backup and then recreate the rest of the nodes, which could be a time-consuming task.
  • Clone Cluster: It is similar to the previous one but the backup and restore process is for the whole cluster, not only one specific database server. In this way, you can clone the entire cluster in the same task and you don’t need to recreate the rest of the nodes manually. This method still has the problem of keeping data up-to-date between clones.
  • Replication: This way includes the backup/restore option, but after the initial restore, the replication process will keep your data synchronized with the master node. In this way, if you have a database cluster, you need to restore the backup to one node, and recreate all the nodes manually.

In this blog, we will see a new ClusterControl 1.7.4 feature that allows you to use a mix of the method that we mentioned earlier to improve this task.

What is Cluster-to-Cluster Replication?

Replication between two clusters is not the same thing as extending a cluster to run across two datacenters. When setting up replication between two clusters, we actually have 2 separate systems that can operate autonomously. Replication is used to keep them in sync, so that the slave system has an updated state and can take over. 

From ClusterControl 1.7.4, it is possible to create a new cluster by directly cloning a running source cluster, or by using a recent backup of the source cluster.

After cloning the cluster, you will have a Slave Cluster (SC) receiving data, and a Master Cluster (MC) sending changes to the slave one.

Database Cluster to Cluster Replication

ClusterControl supports Cluster-to-Cluster Replication for the following cluster types:

Cluster-to-Cluster Replication for Percona XtraDB / MariaDB Galera Cluster

For MySQL based engines, GTID is required to use this feature, and asynchronous replication between the Master and Slave cluster will be used. 

There are a couple of actions to perform in order to prepare the current cluster for this job. First, at least one node on the current cluster must have the binary logs enabled. Then, you need to add the backup user configured in the database node in the ClusterControl configuration file, which will be used for management tasks. All these actions can be performed by using the ClusterControl UI or ClusterControl CLI.

Now you are ready to create the Percona XtraDB/MariaDB Galera Cluster-to-Cluster replication. When the job is finished, you will have:

  • One node in the Slave Cluster will replicate from one node in the Master Cluster.
  • The replication will be bi-directional between the clusters.
  • All nodes in the Slave Cluster will be read-only by default. It is possible to disable the read-only flag on the nodes one by one. 
  • Active-Active clustering is only recommended if applications are only touching disjoint data sets on either Cluster since the engine doesn’t offer any Conflict Detection or Resolution.

From both ClusterControl UI or ClusterControl CLI, you will be able to:

  • Create this Replication Cluster.
  • Enable the Active-Active configuration.
  • Change the Cluster Topology.
  • Rebuild a Replication Cluster.
  • Stop/Start a Replication Slave.
  • Reset Replication Slave (only implemented using ClusterControl CLI atm).

Considerations

  • The backup user must be added manually in the ClusterControl configuration file.
  • The backup user credentials must be the same in both the current and new cluster.
  • The MySQL root password specified when creating the Slave Cluster must be the same as the root password used on the Master Cluster.

Known Limitations

  • Automatic Failover is not supported yet. If the master fails, then it is the responsibility of the administrator to failover to another master.
  • It is only possible to “RESET” a replication slave from the ClusterControl CLI as it’s not implemented in the ClusterControl UI yet.
  • It is only possible to Rebuild a Cluster that is in read-only mode. All nodes in a Cluster must be read-only to count as read-only Cluster.

Cluster-to-Cluster Replication for PostgreSQL

ClusterControl Cluster-to-Cluster Replication is supported on PostgreSQL using streaming replication.

As a requirement, there must be a PostgreSQL server with the ClusterControl role 'master', and when you set up the Slave Cluster, the Admin credentials must be identical to the Master Cluster.

Now you are ready to create the PostgreSQL Cluster-to-Cluster replication. When the job is finished, you will have:

  • One node in the Slave Cluster will replicate from one node in the Master Cluster.
  • The replication will be unidirectional between the clusters.
  • The node in the Slave Cluster will be read-only.
Database Cluster to Cluster Replication for PostgreSQL

From both ClusterControl UI or ClusterControl CLI, you will be able to:

  • Create this Replication Cluster.
  • Rebuild a Replication Cluster.
  • Stop/Start a Replication Slave.

Consideration

  • The Admin Credentials must be identical in the Master and Slave Cluster.

Known Limitations

  • The max size of the Slave Cluster is one node.
  • The Slave Cluster cannot be staged from a backup.
  • Topology changes are not supported.
  • Only unidirectional replication is supported.

Conclusion

Using this new ClusterControl feature, you don’t need to do each step to create a Cluster Replication separately or manually, and as a result of using it, you will save time and effort. Give it a try!

MySQL InnoDB Cluster 8.0 - A Complete Deployment Walk-Through: Part One

$
0
0

MySQL InnoDB Cluster consists of 3 components:

  • MySQL Group Replication (a group of database server which replicates to each other with fault tolerance).
  • MySQL Router (query router to the healthy database nodes)
  • MySQL Shell (helper, client, configuration tool)

In the first part of this walkthrough, we are going to deploy a MySQL InnoDB Cluster. There are a number of hands-on tutorial available online but this walkthrough covers all the necessary steps/commands to install and run the cluster in one place. We will be covering monitoring, management and scaling operations as well as some gotchas when dealing with MySQL InnoDB Cluster in the second part of this blog post.

The following diagram illustrates our post-deployment architecture:

We are going to deploy a total of 4 nodes; A three-node MySQL Group Replication and one MySQL router node co-located within the application server. All servers are running on Ubuntu 18.04 Bionic.

Installing MySQL

The following steps should be performed on all database nodes db1, db2 and db3.

Firstly, we have to do some host mapping. This is crucial if you want to use hostname as the host identifier in InnoDB Cluster and this is the recommended way to do. Map all hosts as the following inside /etc/hosts:

$ vi /etc/hosts

192.168.10.40 router wordpress apps

192.168.10.41 db1 db1.local

192.168.10.42 db2 db2.local

192.168.10.43 db3 db3.local

127.0.0.1 localhost localhost.local

Stop and disable AppArmor:

$ service apparmor stop

$ service apparmor teardown

$ systemctl disable apparmor

Download the latest APT config repository from MySQL Ubuntu repository website at https://repo.mysql.com/apt/ubuntu/pool/mysql-apt-config/m/mysql-apt-config/. At the time of this writing, the latest one is dated 15-Oct-2019 which is mysql-apt-config_0.8.14-1_all.deb:

$ wget https://repo.mysql.com/apt/ubuntu/pool/mysql-apt-config/m/mysql-apt-config/mysql-apt-config_0.8.14-1_all.deb

Install the package and configure it for "mysql-8.0":

$ dpkg -i mysql-apt-config_0.8.14-1_all.deb

Install the GPG key:

$ apt-key adv --recv-keys --keyserver ha.pool.sks-keyservers.net 5072E1F5

Update the repolist:

$ apt-get update

Install Python and followed by MySQL server and MySQL shell:

$ apt-get -y install mysql-server mysql-shell

You will be presented with the following configuration wizards:

  1. Set a root password - Specify a strong password for the MySQL root user.
  2. Set the authentication method - Choose "Use Legacy Authentication Method (Retain MySQL 5.x Compatibility)"

MySQL should have been installed at this point. Verify with:

$ systemctl status mysql

Ensure you get an "active (running)" state.

Preparing the Server for InnoDB Cluster

The following steps should be performed on all database nodes db1, db2 and db3.

Configure the MySQL server to support Group Replication. The easiest and recommended way to do this is to use the new MySQL Shell:

$ mysqlsh

Authenticate as the local root user and follow the configuration wizard accordingly as shown in the example below:

MySQL  JS > dba.configureLocalInstance("root@localhost:3306");

Once authenticated, you should get a number of questions like the following:

Responses to those questions with the following answers:

  • Pick 2 - Create a new admin account for InnoDB cluster with minimal required grants
  • Account Name: clusteradmin@%
  • Password: mys3cret&&
  • Confirm password: mys3cret&&
  • Do you want to perform the required configuration changes?: y
  • Do you want to restart the instance after configuring it?: y

Don't forget to repeat the above on the all database nodes. At this point, the MySQL daemon should be listening to all IP addresses and Group Replication is enabled. We can now proceed to create the cluster.

Creating the Cluster

Now we are ready to create a cluster. On db1, connect as cluster admin from MySQL Shell:

MySQL|JS> shell.connect('clusteradmin@db1:3306');

Creating a session to 'clusteradmin@db1:3306'

Please provide the password for 'clusteradmin@db1:3306': ***********

Save password for 'clusteradmin@db1:3306'? [Y]es/[N]o/Ne[v]er (default No): Y

Fetching schema names for autocompletion... Press ^C to stop.

Your MySQL connection id is 9

Server version: 8.0.18 MySQL Community Server - GPL

No default schema selected; type \use <schema> to set one.<ClassicSession:clusteradmin@db1:3306>

You should be connected as clusteradmin@db1 (you can tell by looking at the prompt string before '>'). We can now create a new cluster:

MySQL|db1:3306 ssl|JS> cluster = dba.createCluster('my_innodb_cluster');

Check the cluster status:

MySQL|db1:3306 ssl|JS> cluster.status()

{

    "clusterName": "my_innodb_cluster",

    "defaultReplicaSet": {

        "name": "default",

        "primary": "db1:3306",

        "ssl": "REQUIRED",

        "status": "OK_NO_TOLERANCE",

        "statusText": "Cluster is NOT tolerant to any failures.",

        "topology": {

            "db1:3306": {

                "address": "db1:3306",

                "mode": "R/W",

                "readReplicas": {},

                "replicationLag": null,

                "role": "HA",

                "status": "ONLINE",

                "version": "8.0.18"

            }

        },

        "topologyMode": "Single-Primary"

    },

    "groupInformationSourceMember": "db1:3306"

}

At this point, only db1 is part of the cluster. The default topology mode is Single-Primary, similar to a replica set concept where only one node is a writer at a time. The remaining nodes in the cluster will be readers. 

Pay attention on the cluster status which says OK_NO_TOLERANCE, and further explanation under statusText key. In a replica set concept, one node will provide no fault tolerance. Minimum of 3 nodes is required in order to automate the primary node failover. We are going to look into this later.

Now add the second node, db2 and accept the default recovery method, "Clone":

MySQL|db1:3306 ssl|JS> cluster.addInstance('clusteradmin@db2:3306');

The following screenshot shows the initialization progress of db2 after we executed the above command. The syncing operation is performed automatically by MySQL:

Check the cluster and db2 status:

MySQL|db1:3306 ssl|JS> cluster.status()

{

    "clusterName": "my_innodb_cluster",

    "defaultReplicaSet": {

        "name": "default",

        "primary": "db1:3306",

        "ssl": "REQUIRED",

        "status": "OK_NO_TOLERANCE",

        "statusText": "Cluster is NOT tolerant to any failures.",

        "topology": {

            "db1:3306": {

                "address": "db1:3306",

                "mode": "R/W",

                "readReplicas": {},

                "replicationLag": null,

                "role": "HA",

                "status": "ONLINE",

                "version": "8.0.18"

            },

            "db2:3306": {

                "address": "db2:3306",

                "mode": "R/O",

                "readReplicas": {},

                "replicationLag": null,

                "role": "HA",

                "status": "ONLINE",

                "version": "8.0.18"

            }

        },

        "topologyMode": "Single-Primary"

    },

    "groupInformationSourceMember": "db1:3306"

}

At this point, we have two nodes in the cluster, db1 and db2. The status is still showing OK_NO_TOLERANCE with further explanation under statusText value. As stated above, MySQL Group Replication requires at least 3 nodes in a cluster for fault tolerance. That's why we have to add the third node as shown next.

Add the last node, db3 and accept the default recovery method, "Clone" similar to db2:

MySQL|db1:3306 ssl|JS> cluster.addInstance('clusteradmin@db3:3306');

The following screenshot shows the initialization progress of db3 after we executed the above command. The syncing operation is performed automatically by MySQL:

Check the cluster and db3 status:

MySQL|db1:3306 ssl|JS> cluster.status()

{

    "clusterName": "my_innodb_cluster",

    "defaultReplicaSet": {

        "name": "default",

        "primary": "db1:3306",

        "ssl": "REQUIRED",

        "status": "OK",

        "statusText": "Cluster is ONLINE and can tolerate up to ONE failure.",

        "topology": {

            "db1:3306": {

                "address": "db1:3306",

                "mode": "R/W",

                "readReplicas": {},

                "replicationLag": null,

                "role": "HA",

                "status": "ONLINE",

                "version": "8.0.18"

            },

            "db2:3306": {

                "address": "db2:3306",

                "mode": "R/O",

                "readReplicas": {},

                "replicationLag": null,

                "role": "HA",

                "status": "ONLINE",

                "version": "8.0.18"

            },

            "db3:3306": {

                "address": "db3:3306",

                "mode": "R/O",

                "readReplicas": {},

                "replicationLag": null,

                "role": "HA",

                "status": "ONLINE",

                "version": "8.0.18"

            }

        },

        "topologyMode": "Single-Primary"

    },

    "groupInformationSourceMember": "db1:3306"

}

Now the cluster looks good, where the status is OK and the cluster can tolerate up to one failure node at one time. The primary node is db1 where it shows "primary": "db1:3306" and "mode": "R/W", while other nodes are in "R/O" state. If you check the read_only and super_read_only values on RO nodes, both are showing as true.

Our MySQL Group Replication deployment is now complete and in synced.

Deploying the Router

On the app server that we are going to run our application, make sure the host mapping is correct:

$ vim /etc/hosts

192.168.10.40 router wordpress apps

192.168.10.41 db1 db1.local

192.168.10.42 db2 db2.local

192.168.10.43 db3 db3.local

127.0.0.1 localhost localhost.local

Stop and disable AppArmor:

$ service apparmor stop

$ service apparmor teardown

$ systemctl disable apparmor

Then install MySQL repository package, similar to what we have done when performing database installation:

$ wget https://repo.mysql.com/apt/ubuntu/pool/mysql-apt-config/m/mysql-apt-config/mysql-apt-config_0.8.14-1_all.deb

$ dpkg -i mysql-apt-config_0.8.14-1_all.deb

Add GPG key:

$ apt-key adv --recv-keys --keyserver ha.pool.sks-keyservers.net 5072E1F5

Update the repo list:

$ apt-get update

Install MySQL router and client:

$ apt-get -y install mysql-router mysql-client

MySQL Router is now installed under /usr/bin/mysqlrouter. MySQL router provides a bootstrap flag to automatically configure the router operation with a MySQL InnoDB cluster. What we need to do is to specify the string URI to one of the database node as the InnoDB cluster admin user (clusteradmin). 

To simplify the configuration, we will run the mysqlrouter process as root user:

$ mysqlrouter --bootstrap clusteradmin@db1:3306 --directory myrouter --user=root

Here is what we should get after specifying the password for clusteradmin user:

The bootstrap command will assist us to generate the router configuration file at /root/myrouter/mysqlrouter.conf. Now we can start the mysqlrouter daemon with the following command from the current directory:

$ myrouter/start.sh

Verify if the anticipated ports are listening correctly:

$ netstat -tulpn | grep mysql

tcp        0 0 0.0.0.0:6446            0.0.0.0:* LISTEN   14726/mysqlrouter

tcp        0 0 0.0.0.0:6447            0.0.0.0:* LISTEN   14726/mysqlrouter

tcp        0 0 0.0.0.0:64470           0.0.0.0:* LISTEN   14726/mysqlrouter

tcp        0 0 0.0.0.0:64460           0.0.0.0:* LISTEN   14726/mysqlrouter

Now our application can use port 6446 for read/write and 6447 for read-only MySQL connections.

Connecting to the Cluster

Let's create a database user on the master node. On db1, connect to the MySQL server via MySQL shell:

$ mysqlsh root@localhost:3306

Switch from Javascript mode to SQL mode:

MySQL|localhost:3306 ssl|JS> \sql

Switching to SQL mode... Commands end with ;

Create a database:

MySQL|localhost:3306 ssl|SQL> CREATE DATABASE sbtest;

Create a database user:

MySQL|localhost:3306 ssl|SQL> CREATE USER sbtest@'%' IDENTIFIED BY 'password';

Grant the user to the database:

MySQL|localhost:3306 ssl|SQL> GRANT ALL PRIVILEGES ON sbtest.* TO sbtest@'%';

Now our database and user is ready. Let's install sysbench to generate some test data. On the app server, do:

$ apt -y install sysbench mysql-client

Now we can test on the app server to connect to the MySQL server via MySQL router. For write connection, connect to port 6446 of the router host:

$ mysql -usbtest -p -h192.168.10.40 -P6446 -e 'select user(), @@hostname, @@read_only, @@super_read_only'

+---------------+------------+-------------+-------------------+

| user()        | @@hostname | @@read_only | @@super_read_only |

+---------------+------------+-------------+-------------------+

| sbtest@router | db1        | 0 |   0 |

+---------------+------------+-------------+-------------------+

For read-only connection, connect to port 6447 of the router host:

$ mysql -usbtest -p -h192.168.10.40 -P6447 -e 'select user(), @@hostname, @@read_only, @@super_read_only'

+---------------+------------+-------------+-------------------+

| user()        | @@hostname | @@read_only | @@super_read_only |

+---------------+------------+-------------+-------------------+

| sbtest@router | db3        | 1 |   1 |

+---------------+------------+-------------+-------------------+

Looks good. We can now generate some test data with sysbench. On the app server, generate 20 tables with 100,000 rows per table by connecting to port 6446 of the app server:

$ sysbench \

/usr/share/sysbench/oltp_common.lua \

--db-driver=mysql \

--mysql-user=sbtest \

--mysql-db=sbtest \

--mysql-password=password \

--mysql-port=6446 \

--mysql-host=192.168.10.40 \

--tables=20 \

--table-size=100000 \

prepare

To perform a simple read-write test on port 6446 for 300 seconds, run:

$ sysbench \

/usr/share/sysbench/oltp_read_write.lua \

--report-interval=2 \

--threads=8 \

--time=300 \

--db-driver=mysql \

--mysql-host=192.168.10.40 \

--mysql-port=6446 \

--mysql-user=sbtest \

--mysql-db=sbtest \

--mysql-password=password \

--tables=20 \

--table-size=100000 \

run

For read-only workloads, we can send the MySQL connection to port 6447:

$ sysbench \

/usr/share/sysbench/oltp_read_only.lua \

--report-interval=2 \

--threads=1 \

--time=300 \

--db-driver=mysql \

--mysql-host=192.168.10.40 \

--mysql-port=6447 \

--mysql-user=sbtest \

--mysql-db=sbtest \

--mysql-password=password \

--tables=20 \

--table-size=100000 \

run

Conclusion

That's it. Our MySQL InnoDB Cluster setup is now complete with all of its components running and tested. In the second part, we are going to look into management, monitoring and scaling operations of the cluster as well as solutions to a number of common problems when dealing with MySQL InnoDB Cluster. Stay tuned!


Database Load Balancing in the Cloud - MySQL Master Failover with ProxySQL 2.0: Part Two (Seamless Failover)

$
0
0

In the previous blog we showed you how to set up an environment in Amazon AWS EC2 that consists of a Percona Server 8.0 Replication Cluster (in Master - Slave topology). We deployed ProxySQL and we configured our application (Sysbench). 

We also used ClusterControl to make the deployment easier, faster and more stable. This is the environment we ended up with...

This is how it looks in ClusterControl:

In this blog post we are going to review the requirements and show you how, in this setup, you can seamlessly perform master switches.

Seamless Master Switch with ProxySQL 2.0

We are going to benefit from ProxySQL ability to queue connections if there are no nodes available in a hostgroup. ProxySQL utilizes hostgroups to differentiate between backend nodes with different roles. You can see the configuration on the screenshot below.

In our case we have two host groups - hostgroup 10 contains writers (master) and hostgroup 20 contains slaves (and also it may contain master, depends on the configuration). As you may know, ProxySQL uses SQL interface for configuration. ClusterControl exposes most of the configuration options in the UI but some settings cannot be set up via ClusterControl (or they are configured automatically by ClusterControl). One of such settings is how the ProxySQL should detect and configure backend nodes in replication environment.

mysql> SELECT * FROM mysql_replication_hostgroups;

+------------------+------------------+------------+-------------+

| writer_hostgroup | reader_hostgroup | check_type | comment     |

+------------------+------------------+------------+-------------+

| 10               | 20 | read_only  | host groups |

+------------------+------------------+------------+-------------+

1 row in set (0.00 sec)

Configuration stored in mysql_replication_hostgroups table defines if and how ProxySQL will automatically assign master and slaves to correct hostgroups. In short, the configuration above tells ProxySQL to assign writers to HG10, readers to HG20. If a node is a writer or reader is determined by the state of variable ‘read_only’. If read_only is enabled, node is marked as reader and assigned to HG20. If not, node is marked as writer and assigned to HG10. On top of that we have a variable:

Which determines if writer should also show up in the readers’ hostgroup or not. In our case it is set to ‘True’ thus our writer (master) is also a part of HG20.

ProxySQL does not manage backend nodes but it does access them and check the state of them, including the state of the read_only variable. This is done by monitoring user, which has been configured by ClusterControl according to your input at the deployment time for ProxySQL. If the state of the variable changes, ProxySQL will reassign it to proper hostgroup, based on the value for read_only variable and based on the settings in mysql-monitor_writer_is_also_reader variable in ProxySQL.

Here enters ClusterControl. ClusterControl monitors the state of the cluster. Should master is not available, failover will occur. It is more complex than that and we explained this process in detail in one of our earlier blogs. What is important for us is that, as long as it is safe, ClusterControl will execute the failover and in the process it will reconfigure read_only variables on old and new master. ProxySQL will see the change and modify its hostgroups accordingly. This will also happen in case of the regular slave promotion, which can easily be executed from ClusterControl by starting this job:

The final outcome will be that the new master will be promoted and assigned to HG10 in ProxySQL while the old master will be reconfigured as a slave (and it will be a part of HG20 in ProxySQL). The process of master change may take a while depending on environment, application and traffic (it is even possible to failover in  11 seconds, as my colleague has tested). During this time database (master) will not be reachable in ProxySQL. This leads to some problems. For starters, the application will receive errors from the database and user experience will suffer - no one likes to see errors. Luckily, under some circumstances,  we can reduce the impact. The requirement for this is that the application does not use (at all or at that particular time) multi-statement transactions. This is quite expected - if you have a multi-statement transaction (so, BEGIN; … ; COMMIT;) you cannot move it from server to server because this will no longer be a transaction. In such cases the only safe way is to rollback the transaction and start once more on a new master. Prepared statements are also a no-no: they are prepared on a particular host (master) and they do not exist on slaves so once one slave will be promoted to a new master, it is not possible for it to execute prepared statements which has been prepared on old master. On the other hand if you run only auto-committed, single-statement transactions, you can benefit from the feature we are going to describe below.

One of the great features ProxySQL has is an ability to queue incoming transactions if they are directed to a hostgroup that does not have any nodes available. This is defined by following two variables:

ClusterControl increases them to 20 seconds, allowing even for quite some long failovers to perform without any error being sent to the application.

Testing the Seamless Master Switch

We are going to run the test in our environment. As the application we are going to use SysBench started as:

while true ; do sysbench /root/sysbench/src/lua/oltp_read_write.lua --threads=4 --events=0 --time=3600 --reconnect=1 --mysql-socket=/tmp/proxysql.sock --mysql-user=sbtest --mysql-password=sbtest --tables=32 --report-interval=1 --skip-trx=on --table-size=100000 --db-ps-mode=disable --rate=5 run ; done

Basically, we will run sysbench in a loop (in case an error show up). We will run it in 4 threads. Threads will reconnect after every transaction. There will be no multi-statement transactions and we will not use prepared statements. Then we will trigger the master switch by promoting a slave in the ClusterControl UI. This is how the master switch looks like from the application standpoint:

[ 560s ] thds: 4 tps: 5.00 qps: 90.00 (r/w/o: 70.00/20.00/0.00) lat (ms,95%): 18.95 err/s: 0.00 reconn/s: 5.00

[ 560s ] queue length: 0, concurrency: 0

[ 561s ] thds: 4 tps: 5.00 qps: 90.00 (r/w/o: 70.00/20.00/0.00) lat (ms,95%): 17.01 err/s: 0.00 reconn/s: 5.00

[ 561s ] queue length: 0, concurrency: 0

[ 562s ] thds: 4 tps: 7.00 qps: 126.00 (r/w/o: 98.00/28.00/0.00) lat (ms,95%): 28.67 err/s: 0.00 reconn/s: 7.00

[ 562s ] queue length: 0, concurrency: 0

[ 563s ] thds: 4 tps: 3.00 qps: 68.00 (r/w/o: 56.00/12.00/0.00) lat (ms,95%): 17.95 err/s: 0.00 reconn/s: 3.00

[ 563s ] queue length: 0, concurrency: 1

We can see that the queries are being executed with low latency.

[ 564s ] thds: 4 tps: 0.00 qps: 42.00 (r/w/o: 42.00/0.00/0.00) lat (ms,95%): 0.00 err/s: 0.00 reconn/s: 0.00

[ 564s ] queue length: 1, concurrency: 4

Then the queries paused - you can see this by the latency being zero and transactions per second being equal to zero as well.

[ 565s ] thds: 4 tps: 0.00 qps: 0.00 (r/w/o: 0.00/0.00/0.00) lat (ms,95%): 0.00 err/s: 0.00 reconn/s: 0.00

[ 565s ] queue length: 5, concurrency: 4

[ 566s ] thds: 4 tps: 0.00 qps: 0.00 (r/w/o: 0.00/0.00/0.00) lat (ms,95%): 0.00 err/s: 0.00 reconn/s: 0.00

[ 566s ] queue length: 15, concurrency: 4

Two seconds in queue is growing, still no response coming from the database.

[ 567s ] thds: 4 tps: 20.00 qps: 367.93 (r/w/o: 279.95/87.98/0.00) lat (ms,95%): 3639.94 err/s: 0.00 reconn/s: 20.00

[ 567s ] queue length: 1, concurrency: 4

After three seconds application was finally able to reach the database again. You can see the traffic is now non-zero and the queue length has been reduced. You can see the latency around 3.6 seconds - this is for how long the queries have been paused

[ 568s ] thds: 4 tps: 10.00 qps: 116.04 (r/w/o: 84.03/32.01/0.00) lat (ms,95%): 539.71 err/s: 0.00 reconn/s: 10.00

[ 568s ] queue length: 0, concurrency: 0

[ 569s ] thds: 4 tps: 4.00 qps: 72.00 (r/w/o: 56.00/16.00/0.00) lat (ms,95%): 16.12 err/s: 0.00 reconn/s: 4.00

[ 569s ] queue length: 0, concurrency: 0

[ 570s ] thds: 4 tps: 8.00 qps: 144.01 (r/w/o: 112.00/32.00/0.00) lat (ms,95%): 24.83 err/s: 0.00 reconn/s: 8.00

[ 570s ] queue length: 0, concurrency: 0

[ 571s ] thds: 4 tps: 5.00 qps: 98.99 (r/w/o: 78.99/20.00/0.00) lat (ms,95%): 21.50 err/s: 0.00 reconn/s: 5.00

[ 571s ] queue length: 0, concurrency: 1

[ 572s ] thds: 4 tps: 5.00 qps: 80.98 (r/w/o: 60.99/20.00/0.00) lat (ms,95%): 17.95 err/s: 0.00 reconn/s: 5.00

[ 572s ] queue length: 0, concurrency: 0

[ 573s ] thds: 4 tps: 2.00 qps: 36.01 (r/w/o: 28.01/8.00/0.00) lat (ms,95%): 14.46 err/s: 0.00 reconn/s: 2.00

[ 573s ] queue length: 0, concurrency: 0

Everything is stable again, total impact for the master switch was 3.6 second increase in the latency and no traffic hitting database for 3.6 seconds. Other than that the master switch was transparent to the application. Of course, whether it will be 3.6 seconds or more depends on the environment, traffic and so on but as long as the master switch can be performed under 20 seconds, no error will be returned to the application.

Conclusion

As you can see, with ClusterControl and ProxySQL 2.0 you are just a couple of clicks from achieving a seamless failover and master switch for your MySQL Replication clusters.


MySQL InnoDB Cluster 8.0 - A Complete Operation Walk-through: Part Two

$
0
0

In the first part of this blog, we covered a deployment walkthrough of MySQL InnoDB Cluster with an example on how the applications can connect to the cluster via a dedicated read/write port.

In this operation walkthrough, we are going to show examples on how to monitor, manage and scale the InnoDB Cluster as part of the ongoing cluster maintenance operations. We’ll use the same cluster what we deployed in the first part of the blog. The following diagram shows our architecture:

We have a three-node MySQL Group Replication and one application server running with MySQL router. All servers are running on Ubuntu 18.04 Bionic.

MySQL InnoDB Cluster Command Options

Before we move further with some examples and explanations, it's good to know that you can get an explanation of each function in MySQL cluster for cluster component by using the help() function, as shown below:

$ mysqlsh
MySQL|localhost:3306 ssl|JS> shell.connect("clusteradmin@db1:3306");
MySQL|db1:3306 ssl|JS> cluster = dba.getCluster();<Cluster:my_innodb_cluster>
MySQL|db1:3306 ssl|JS> cluster.help()

The following list shows the available functions on MySQL Shell 8.0.18, for MySQL Community Server 8.0.18:

  • addInstance(instance[, options]) - Adds an Instance to the cluster.
  • checkInstanceState(instance)- Verifies the instance gtid state in relation to the cluster.
  • describe()- Describe the structure of the cluster.
  • disconnect() - Disconnects all internal sessions used by the cluster object.
  • dissolve([options])- Deactivates replication and unregisters the ReplicaSets from the cluster.
  • forceQuorumUsingPartitionOf(instance[, password]) - Restores the cluster from quorum loss.
  • getName() - Retrieves the name of the cluster.
  • help([member])- Provides help about this class and it's members
  • options([options]) - Lists the cluster configuration options.
  • rejoinInstance(instance[, options]) - Rejoins an Instance to the cluster.
  • removeInstance(instance[, options]) - Removes an Instance from the cluster.
  • rescan([options]) - Rescans the cluster.
  • resetRecoveryAccountsPassword(options) - Reset the password of the recovery accounts of the cluster.
  • setInstanceOption(instance, option, value)- Changes the value of a configuration option in a Cluster member.
  • setOption(option, value) - Changes the value of a configuration option for the whole cluster.
  • setPrimaryInstance(instance) - Elects a specific cluster member as the new primary.
  • status([options])- Describe the status of the cluster.
  • switchToMultiPrimaryMode() - Switches the cluster to multi-primary mode.
  • switchToSinglePrimaryMode([instance]) - Switches the cluster to single-primary mode.

We are going to look into most of the functions available to help us monitor, manage and scale the cluster.

Monitoring MySQL InnoDB Cluster Operations

Cluster Status

To check the cluster status, firstly use the MySQL shell command line and then connect as clusteradmin@{one-of-the-db-nodes}:

$ mysqlsh
MySQL|localhost:3306 ssl|JS> shell.connect("clusteradmin@db1:3306");

Then, create an object called "cluster" and declare it as "dba" global object which provides access to InnoDB cluster administration functions using the AdminAPI (check out MySQL Shell API docs):

MySQL|db1:3306 ssl|JS> cluster = dba.getCluster();<Cluster:my_innodb_cluster>

Then, we can use the object name to call the API functions for "dba" object:

MySQL|db1:3306 ssl|JS> cluster.status()
{
    "clusterName": "my_innodb_cluster",
    "defaultReplicaSet": {
        "name": "default",
        "primary": "db1:3306",
        "ssl": "REQUIRED",
        "status": "OK",
        "statusText": "Cluster is ONLINE and can tolerate up to ONE failure.",
        "topology": {
            "db1:3306": {
                "address": "db1:3306",
                "mode": "R/W",
                "readReplicas": {},
                "replicationLag": null,
                "role": "HA",
                "status": "ONLINE",
                "version": "8.0.18"
            },
            "db2:3306": {
                "address": "db2:3306",
                "mode": "R/O",
                "readReplicas": {},
                "replicationLag": "00:00:09.061918",
                "role": "HA",
                "status": "ONLINE",
                "version": "8.0.18"
            },
            "db3:3306": {
                "address": "db3:3306",
                "mode": "R/O",
                "readReplicas": {},
                "replicationLag": "00:00:09.447804",
                "role": "HA",
                "status": "ONLINE",
                "version": "8.0.18"
            }
        },
        "topologyMode": "Single-Primary"
    },
    "groupInformationSourceMember": "db1:3306"
}

The output is pretty long but we can filter it out by using the map structure. For example, if we would like to view the replication lag for db3 only, we could do like the following:

MySQL|db1:3306 ssl|JS> cluster.status().defaultReplicaSet.topology["db3:3306"].replicationLag
00:00:09.447804

Note that replication lag is something that will happen in group replication, depending on the write intensivity of the primary member in the replica set and the group_replication_flow_control_* variables. We are not going to cover this topic in detail here. Check out this blog post to understand further on the group replication performance and flow control.

Another similar function is the describe() function, but this one is a bit more simple. It describes the structure of the cluster including all its information, ReplicaSets and Instances:

MySQL|db1:3306 ssl|JS> cluster.describe()
{
    "clusterName": "my_innodb_cluster",
    "defaultReplicaSet": {
        "name": "default",
        "topology": [
            {
                "address": "db1:3306",
                "label": "db1:3306",
                "role": "HA"
            },
            {
                "address": "db2:3306",
                "label": "db2:3306",
                "role": "HA"
            },
            {
                "address": "db3:3306",
                "label": "db3:3306",
                "role": "HA"
            }
        ],
        "topologyMode": "Single-Primary"
    }
}

Similarly, we can filter the JSON output using map structure:

MySQL|db1:3306 ssl|JS> cluster.describe().defaultReplicaSet.topologyMode
Single-Primary

When the primary node went down (in this case, is db1), the output returned the following:

MySQL|db1:3306 ssl|JS> cluster.status()

{
    "clusterName": "my_innodb_cluster",
    "defaultReplicaSet": {
        "name": "default",
        "primary": "db2:3306",
        "ssl": "REQUIRED",
        "status": "OK_NO_TOLERANCE",
        "statusText": "Cluster is NOT tolerant to any failures. 1 member is not active",
        "topology": {
            "db1:3306": {
                "address": "db1:3306",
                "mode": "n/a",
                "readReplicas": {},
                "role": "HA",
                "shellConnectError": "MySQL Error 2013 (HY000): Lost connection to MySQL server at 'reading initial communication packet', system error: 104",
                "status": "(MISSING)"
            },
            "db2:3306": {
                "address": "db2:3306",
                "mode": "R/W",
                "readReplicas": {},
                "replicationLag": null,
                "role": "HA",
                "status": "ONLINE",
                "version": "8.0.18"
            },
            "db3:3306": {
                "address": "db3:3306",
                "mode": "R/O",
                "readReplicas": {},
                "replicationLag": null,
                "role": "HA",
                "status": "ONLINE",
                "version": "8.0.18"
            }
        },
        "topologyMode": "Single-Primary"
    },
    "groupInformationSourceMember": "db2:3306"
}

Pay attention to the status OK_NO_TOLERANCE, where the cluster is still up and running but it can't tolerate any more failure after one over three node is not available. The primary role has been taken over by db2 automatically, and the database connections from the application will be rerouted to the correct node if they connect through MySQL Router. Once db1 comes back online, we should see the following status:

MySQL|db1:3306 ssl|JS> cluster.status()
{
    "clusterName": "my_innodb_cluster",
    "defaultReplicaSet": {
        "name": "default",
        "primary": "db2:3306",
        "ssl": "REQUIRED",
        "status": "OK",
        "statusText": "Cluster is ONLINE and can tolerate up to ONE failure.",
        "topology": {
            "db1:3306": {
                "address": "db1:3306",
                "mode": "R/O",
                "readReplicas": {},
                "replicationLag": null,
                "role": "HA",
                "status": "ONLINE",
                "version": "8.0.18"
            },
            "db2:3306": {
                "address": "db2:3306",
                "mode": "R/W",
                "readReplicas": {},
                "replicationLag": null,
                "role": "HA",
                "status": "ONLINE",
                "version": "8.0.18"
            },
            "db3:3306": {
                "address": "db3:3306",
                "mode": "R/O",
                "readReplicas": {},
                "replicationLag": null,
                "role": "HA",
                "status": "ONLINE",
                "version": "8.0.18"
            }
        },
        "topologyMode": "Single-Primary"
    },
    "groupInformationSourceMember": "db2:3306"
}

It shows that db1 is now available but served as secondary with read-only enabled. The primary role is still assigned to db2 until something goes wrong to the node, where it will be automatically failed over to the next available node.

Check Instance State

We can check the state of a MySQL node before planning to add it into the cluster by using the checkInstanceState() function. It analyzes the instance executed GTIDs with the executed/purged GTIDs on the cluster to determine if the instance is valid for the cluster.

The following shows instance state of db3 when it was in standalone mode, before part of the cluster:

MySQL|db1:3306 ssl|JS> cluster.checkInstanceState("db3:3306")
Cluster.checkInstanceState: The instance 'db3:3306' is a standalone instance but is part of a different InnoDB Cluster (metadata exists, instance does not belong to that metadata, and Group Replication is not active).

If the node is already part of the cluster, you should get the following:

MySQL|db1:3306 ssl|JS> cluster.checkInstanceState("db3:3306")
Cluster.checkInstanceState: The instance 'db3:3306' already belongs to the ReplicaSet: 'default'.

Monitor Any "Queryable" State

With MySQL Shell, we can now use the built-in \show and \watch command to monitor any administrative query in real-time. For example, we can get the real-time value of threads connected by using:

MySQL|db1:3306 ssl|JS> \show query SHOW STATUS LIKE '%thread%';

Or get the current MySQL processlist:

MySQL|db1:3306 ssl|JS> \show query SHOW FULL PROCESSLIST

We can then use \watch command to run a report in the same way as the \show command, but it refreshes the results at regular intervals until you cancel the command using Ctrl + C. As shown in the following examples:

MySQL|db1:3306 ssl|JS> \watch query SHOW STATUS LIKE '%thread%';
MySQL|db1:3306 ssl|JS> \watch query --interval=1 SHOW FULL PROCESSLIST

The default refresh interval is 2 seconds. You can change the value by using the --interval flag and specified a value from 0.1 up to 86400.

MySQL InnoDB Cluster Management Operations

Primary Switchover

Primary instance is the node that can be considered as the leader in a replication group, that has the ability to perform read and write operations. Only one primary instance per cluster is allowed in single-primary topology mode. This topology is also known as replica set and is the recommended topology mode for Group Replication with protection against locking conflicts.

To perform primary instance switchover, login to one of the database nodes as the clusteradmin user and specify the database node that you want to promote by using the setPrimaryInstance() function:

MySQL|db1:3306 ssl|JS> shell.connect("clusteradmin@db1:3306");
MySQL|db1:3306 ssl|JS> cluster.setPrimaryInstance("db1:3306");
Setting instance 'db1:3306' as the primary instance of cluster 'my_innodb_cluster'...

Instance 'db2:3306' was switched from PRIMARY to SECONDARY.
Instance 'db3:3306' remains SECONDARY.
Instance 'db1:3306' was switched from SECONDARY to PRIMARY.

WARNING: The cluster internal session is not the primary member anymore. For cluster management operations please obtain a fresh cluster handle using <Dba>.getCluster().

The instance 'db1:3306' was successfully elected as primary.

We just promoted db1 as the new primary component, replacing db2 while db3 remains as the secondary node.

Shutting Down the Cluster

The best way to shut down the cluster gracefully by stopping the MySQL Router service first (if it's running) on the application server:

$ myrouter/stop.sh

The above step provides cluster protection against accidental writes by the applications. Then shutdown one database node at a time using the standard MySQL stop command, or perform system shutdown as you wish:

$ systemctl stop mysql

Starting the Cluster After a Shutdown

If your cluster suffers from a complete outage or you want to start the cluster after a clean shutdown, you can ensure it is reconfigured correctly using dba.rebootClusterFromCompleteOutage() function. It simply brings a cluster back ONLINE when all members are OFFLINE. In the event that a cluster has completely stopped, the instances must be started and only then can the cluster be started.

Thus, ensure all MySQL servers are started and running. On every database node, see if the mysqld process is running:

$ ps -ef | grep -i mysql

Then, pick one database server to be the primary node and connect to it via MySQL shell:

MySQL|JS> shell.connect("clusteradmin@db1:3306");

Run the following command from that host to start them up:

MySQL|db1:3306 ssl|JS> cluster = dba.rebootClusterFromCompleteOutage()

You will be presented with the following questions:

After the above completes, you can verify the cluster status:

MySQL|db1:3306 ssl|JS> cluster.status()

At this point, db1 is the primary node and the writer. The rest will be the secondary members. If you would like to start the cluster with db2 or db3 as the primary, you could use the shell.connect() function to connect to the corresponding node and perform the rebootClusterFromCompleteOutage() from that particular node.

You can then start the MySQL Router service (if it's not started) and let the application connect to the cluster again.

Setting Member and Cluster Options

To get the cluster-wide options, simply run:

MySQL|db1:3306 ssl|JS> cluster.options()

The above will list out the global options for the replica set and also individual options per member in the cluster. This function changes an InnoDB Cluster configuration option in all members of the cluster. The supported options are:

  • clusterName: string value to define the cluster name.
  • exitStateAction: string value indicating the group replication exit state action.
  • memberWeight: integer value with a percentage weight for automatic primary election on failover.
  • failoverConsistency: string value indicating the consistency guarantees that the cluster provides.
  • consistency: string value indicating the consistency guarantees that the cluster provides.
  • expelTimeout: integer value to define the time period in seconds that cluster members should wait for a non-responding member before evicting it from the cluster.
  • autoRejoinTries: integer value to define the number of times an instance will attempt to rejoin the cluster after being expelled.
  • disableClone: boolean value used to disable the clone usage on the cluster.

Similar to other function, the output can be filtered in map structure. The following command will only list out the options for db2:

MySQL|db1:3306 ssl|JS> cluster.options().defaultReplicaSet.topology["db2:3306"]

You can also get the above list by using the help() function:

MySQL|db1:3306 ssl|JS> cluster.help("setOption")

The following command shows an example to set an option called memberWeight to 60 (from 50) on all members:

MySQL|db1:3306 ssl|JS> cluster.setOption("memberWeight", 60)
Setting the value of 'memberWeight' to '60' in all ReplicaSet members ...

Successfully set the value of 'memberWeight' to '60' in the 'default' ReplicaSet.

We can also perform configuration management automatically via MySQL Shell by using setInstanceOption() function and pass the database host, the option name and value accordingly:

MySQL|db1:3306 ssl|JS> cluster = dba.getCluster()
MySQL|db1:3306 ssl|JS> cluster.setInstanceOption("db1:3306", "memberWeight", 90)

The supported options are:

  • exitStateAction: string value indicating the group replication exit state action.
  • memberWeight: integer value with a percentage weight for automatic primary election on failover.
  • autoRejoinTries: integer value to define the number of times an instance will attempt to rejoin the cluster after being expelled.
  • label a string identifier of the instance.

Switching to Multi-Primary/Single-Primary Mode

By default, InnoDB Cluster is configured with single-primary, only one member capable of performing reads and writes at one given time. This is the safest and recommended way to run the cluster and suitable for most workloads. 

However, if the application logic can handle distributed writes, it's probably a good idea to switch to multi-primary mode, where all members in the cluster are able to process reads and writes at the same time. To switch from single-primary to multi-primary mode, simply use the switchToMultiPrimaryMode() function:

MySQL|db1:3306 ssl|JS> cluster.switchToMultiPrimaryMode()
Switching cluster 'my_innodb_cluster' to Multi-Primary mode...

Instance 'db2:3306' was switched from SECONDARY to PRIMARY.
Instance 'db3:3306' was switched from SECONDARY to PRIMARY.
Instance 'db1:3306' remains PRIMARY.

The cluster successfully switched to Multi-Primary mode.

Verify with:

MySQL|db1:3306 ssl|JS> cluster.status()
{
    "clusterName": "my_innodb_cluster",
    "defaultReplicaSet": {
        "name": "default",
        "ssl": "REQUIRED",
        "status": "OK",
        "statusText": "Cluster is ONLINE and can tolerate up to ONE failure.",
        "topology": {
            "db1:3306": {
                "address": "db1:3306",
                "mode": "R/W",
                "readReplicas": {},
                "replicationLag": null,
                "role": "HA",
                "status": "ONLINE",
                "version": "8.0.18"
            },
            "db2:3306": {
                "address": "db2:3306",
                "mode": "R/W",
                "readReplicas": {},
                "replicationLag": null,
                "role": "HA",
                "status": "ONLINE",
                "version": "8.0.18"
            },
            "db3:3306": {
                "address": "db3:3306",
                "mode": "R/W",
                "readReplicas": {},
                "replicationLag": null,
                "role": "HA",
                "status": "ONLINE",
                "version": "8.0.18"
            }
        },
        "topologyMode": "Multi-Primary"
    },
    "groupInformationSourceMember": "db1:3306"
}

In multi-primary mode, all nodes are primary and able to process reads and writes. When sending a new connection via MySQL Router on single-writer port (6446), the connection will be sent to only one node, as in this example, db1:

(app-server)$ for i in {1..3}; do mysql -usbtest -p -h192.168.10.40 -P6446 -e 'select @@hostname, @@read_only, @@super_read_only'; done

+------------+-------------+-------------------+
| @@hostname | @@read_only | @@super_read_only |
+------------+-------------+-------------------+
| db1        | 0           |                 0 |
+------------+-------------+-------------------+

+------------+-------------+-------------------+
| @@hostname | @@read_only | @@super_read_only |
+------------+-------------+-------------------+
| db1        | 0           |                 0 |
+------------+-------------+-------------------+

+------------+-------------+-------------------+
| @@hostname | @@read_only | @@super_read_only |
+------------+-------------+-------------------+
| db1        | 0           |                 0 |
+------------+-------------+-------------------+

If the application connects to the multi-writer port (6447), the connection will be load balanced via round robin algorithm to all members:

(app-server)$ for i in {1..3}; do mysql -usbtest -ppassword -h192.168.10.40 -P6447 -e 'select @@hostname, @@read_only, @@super_read_only'; done

+------------+-------------+-------------------+
| @@hostname | @@read_only | @@super_read_only |
+------------+-------------+-------------------+
| db2        | 0           |                 0 |
+------------+-------------+-------------------+

+------------+-------------+-------------------+
| @@hostname | @@read_only | @@super_read_only |
+------------+-------------+-------------------+
| db3        | 0           |                 0 |
+------------+-------------+-------------------+

+------------+-------------+-------------------+

| @@hostname | @@read_only | @@super_read_only |

+------------+-------------+-------------------+
| db1        | 0           |                 0 |
+------------+-------------+-------------------+

As you can see from the output above, all nodes are capable of processing reads and writes with read_only = OFF. You can distribute safe writes to all members by connecting to the multi-writer port (6447), and send the conflicting or heavy writes to the single-writer port (6446).

To switch back to the single-primary mode, use the switchToSinglePrimaryMode() function and specify one member as the primary node. In this example, we chose db1:

MySQL|db1:3306 ssl|JS> cluster.switchToSinglePrimaryMode("db1:3306");

Switching cluster 'my_innodb_cluster' to Single-Primary mode...

Instance 'db2:3306' was switched from PRIMARY to SECONDARY.
Instance 'db3:3306' was switched from PRIMARY to SECONDARY.
Instance 'db1:3306' remains PRIMARY.

WARNING: Existing connections that expected a R/W connection must be disconnected, i.e. instances that became SECONDARY.

The cluster successfully switched to Single-Primary mode.

At this point, db1 is now the primary node configured with read-only disabled and the rest will be configured as secondary with read-only enabled.

MySQL InnoDB Cluster Scaling Operations

Scaling Up (Adding a New DB Node)

When adding a new instance, a node has to be provisioned first before it's allowed to participate with the replication group. The provisioning process will be handled automatically by MySQL. Also, you can check the instance state first whether the node is valid to join the cluster by using checkInstanceState() function as previously explained.

To add a new DB node, use the addInstances() function and specify the host:

MySQL|db1:3306 ssl|JS> cluster.addInstance("db3:3306")

The following is what you would get when adding a new instance:

Verify the new cluster size with:

MySQL|db1:3306 ssl|JS> cluster.status() //or cluster.describe()

MySQL Router will automatically include the added node, db3 into the load balancing set.

Scaling Down (Removing a Node)

To remove a node, connect to any of the DB nodes except the one that we are going to remove and use the removeInstance() function with the database instance name:

MySQL|db1:3306 ssl|JS> shell.connect("clusteradmin@db1:3306");
MySQL|db1:3306 ssl|JS> cluster = dba.getCluster()
MySQL|db1:3306 ssl|JS> cluster.removeInstance("db3:3306")

The following is what you would get when removing an instance:

Verify the new cluster size with:

MySQL|db1:3306 ssl|JS> cluster.status() //or cluster.describe()

MySQL Router will automatically exclude the removed node, db3 from the load balancing set.

Adding a New Replication Slave

We can scale out the InnoDB Cluster with asynchronous replication slave replicates from any of the cluster nodes. A slave is loosely coupled to the cluster, and will be able to handle a heavy load without affecting the performance of the cluster. The slave can also be a live copy of the Galera cluster for disaster recovery purposes. In multi-primary mode, you can use the slave as the dedicated MySQL read-only processor to scale out the reads workload, perform analytices operation, or as a dedicated backup server.

On the slave server, download the latest APT config package, install it (choose MySQL 8.0 in the configuration wizard), install the APT key, update repolist and install MySQL server.

$ wget https://repo.mysql.com/apt/ubuntu/pool/mysql-apt-config/m/mysql-apt-config/mysql-apt-config_0.8.14-1_all.deb
$ dpkg -i mysql-apt-config_0.8.14-1_all.deb
$ apt-key adv --recv-keys --keyserver ha.pool.sks-keyservers.net 5072E1F5
$ apt-get update
$ apt-get -y install mysql-server mysql-shell

Modify the MySQL configuration file to prepare the server for replication slave. Open the configuration file via text editor:

$ vim /etc/mysql/mysql.conf.d/mysqld.cnf

And append the following lines:

server-id = 1044 # must be unique across all nodes
gtid-mode = ON
enforce-gtid-consistency = ON
log-slave-updates = OFF
read-only = ON
super-read-only = ON
expire-logs-days = 7

Restart MySQL server on the slave to apply the changes:

$ systemctl restart mysql

On one of the InnoDB Cluster servers (we chose db3), create a replication slave user and followed by a full MySQL dump:

$ mysql -uroot -p
mysql> CREATE USER 'repl_user'@'192.168.0.44' IDENTIFIED BY 'password';
mysql> GRANT REPLICATION SLAVE ON *.* TO 'repl_user'@'192.168.0.44';
mysql> exit
$ mysqldump -uroot -p --single-transaction --master-data=1 --all-databases --triggers --routines --events > dump.sql

Transfer the dump file from db3 to the slave:

$ scp dump.sql root@slave:~

And perform the restoration on the slave:

$ mysql -uroot -p < dump.sql

With master-data=1, our MySQL dump file will automatically configure the GTID executed and purged value. We can verify it with the following statement on the slave server after the restoration:

$ mysql -uroot -p
mysql> show global variables like '%gtid%';
+----------------------------------+----------------------------------------------+
| Variable_name                    | Value                                        |
+----------------------------------+----------------------------------------------+
| binlog_gtid_simple_recovery      | ON                                           |
| enforce_gtid_consistency         | OFF                                          |
| gtid_executed                    | d4790339-0694-11ea-8fd5-02f67042125d:1-45886 |
| gtid_executed_compression_period | 1000                                         |
| gtid_mode                        | OFF                                          |
| gtid_owned                       |                                              |
| gtid_purged                      | d4790339-0694-11ea-8fd5-02f67042125d:1-45886 |
| session_track_gtids              | OFF                                          |
+----------------------------------+----------------------------------------------+

Looks good. We can then configure the replication link and start the replication threads on the slave:

mysql> CHANGE MASTER TO MASTER_HOST = '192.168.10.43', MASTER_USER = 'repl_user', MASTER_PASSWORD = 'password', MASTER_AUTO_POSITION = 1;
mysql> START SLAVE;

Verify the replication state and ensure the following status return 'Yes':

mysql> show slave status\G
...
             Slave_IO_Running: Yes
            Slave_SQL_Running: Yes
...

At this point, our architecture is now looking like this:


Common Issues with MySQL InnoDB Clusters

Memory Exhaustion

When using MySQL Shell with MySQL 8.0, we were constantly getting the following error when the instances were configured with 1GB of RAM:

Can't create a new thread (errno 11); if you are not out of available memory, you can consult the manual for a possible OS-dependent bug (MySQL Error 1135)

Upgrading each host's RAM to 2GB of RAM solved the problem. Apparently, MySQL 8.0 components require more RAM to operate efficiently.

Lost Connection to MySQL Server

In case the primary node goes down, you would probably see the "lost connection to MySQL server error" when trying to query something on the current session:

MySQL|db1:3306 ssl|JS> cluster.status()
Cluster.status: Lost connection to MySQL server during query (MySQL Error 2013)

MySQL|db1:3306 ssl|JS> cluster.status()
Cluster.status: MySQL server has gone away (MySQL Error 2006)

The solution is to re-declare the object once more:

MySQL|db1:3306 ssl|JS> cluster = dba.getCluster()<Cluster:my_innodb_cluster>
MySQL|db1:3306 ssl|JS> cluster.status()

At this point, it will connect to the newly promoted primary node to retrieve the cluster status.

Node Eviction and Expelled

In an event where communication between nodes is interrupted, the problematic node will be evicted from the cluster without any delay, which is not good if you are running on a non-stable network. This is what it looks like on db2 (the problematic node):

2019-11-14T07:07:59.344888Z 0 [ERROR] [MY-011505] [Repl] Plugin group_replication reported: 'Member was expelled from the group due to network failures, changing member status to ERROR.'
2019-11-14T07:07:59.371966Z 0 [ERROR] [MY-011712] [Repl] Plugin group_replication reported: 'The server was automatically set into read only mode after an error was detected.'

Meanwhile from db1, it saw db2 was offline:

2019-11-14T07:07:44.086021Z 0 [Warning] [MY-011493] [Repl] Plugin group_replication reported: 'Member with address db2:3306 has become unreachable.'
2019-11-14T07:07:46.087216Z 0 [Warning] [MY-011499] [Repl] Plugin group_replication reported: 'Members removed from the group: db2:3306'

To tolerate a bit of delay on node eviction, we can set a higher timeout value before a node is being expelled from the group. The default value is 0, which means expel immediately. Use the setOption() function to set the expelTimeout value:

Thanks to Frédéric Descamps from Oracle who pointed this out:

Instead of relying on expelTimeout, it's recommended to set the autoRejoinTries option instead. The value represents the number of times an instance will attempt to rejoin the cluster after being expelled. A good number to start is 3, which means, the expelled member will try to rejoin the cluster for 3 times, which after an unsuccessful auto-rejoin attempt, the member waits 5 minutes before the next try.

To set this value cluster-wide, we can use the setOption() function:

MySQL|db1:3306 ssl|JS> cluster.setOption("autoRejoinTries", 3)
WARNING: Each cluster member will only proceed according to its exitStateAction if auto-rejoin fails (i.e. all retry attempts are exhausted).

Setting the value of 'autoRejoinTries' to '3' in all ReplicaSet members ...

Successfully set the value of 'autoRejoinTries' to '3' in the 'default' ReplicaSet.


Conclusion

For MySQL InnoDB Cluster, most of the management and monitoring operations can be performed directly via MySQL Shell (only available from MySQL 5.7.21 and later).

How ClusterControl Performs Automatic Database Recovery and Failover

$
0
0

ClusterControl is programmed with a number of recovery algorithms to automatically respond to different types of common failures affecting your database systems. It understands different types of database topologies and database-related process management to help you determine the best way to recover the cluster. In a way, ClusterControl improves your database availability.

Some topology managers only cover cluster recovery like MHA, Orchestrator and mysqlfailover but you have to handle the node recovery by yourself. ClusterControl supports recovery at both cluster and node level.

Configuration Options

There are two recovery components supported by ClusterControl, namely:

  • Cluster - Attempt to recover a cluster to an operational state
  • Node - Attempt to recover a node to an operational state

These two components are the most important things in order to make sure the service availability is as high as possible. If you already have a topology manager on top of ClusterControl, you can disable automatic recovery feature and let other topology manager handle it for you. You have all the possibilities with ClusterControl. 

The automatic recovery feature can be enabled and disabled with a simple toggle ON/OFF, and it works for cluster or node recovery. The green icons mean enabled and red icons means disabled. The following screenshot shows where you can find it in the database cluster list:

There are 3 ClusterControl parameters that can be used to control the recovery behaviour. All parameters are default to true (set with boolean integer 0 or 1):

  • enable_autorecovery - Enable cluster and node recovery. This parameter is the superset of enable_cluster_recovery and enable_node_recovery. If it's set to 0, the subset parameters will be turned off.
  • enable_cluster_recovery - ClusterControl will perform cluster recovery if enabled.
  • enable_node_recovery - ClusterControl will perform node recovery if enabled.

Cluster recovery covers recovery attempt to bring up entire cluster topology. For example, a master-slave replication must have at least one master alive at any given time, regardless of the number of available slave(s). ClusterControl attempts to correct the topology at least once for replication clusters, but infinitely for multi-master replication like NDB Cluster and Galera Cluster.

Node recovery covers node recovery issue like if a node was being stopped without ClusterControl knowledge, e.g, via system stop command from SSH console or being killed by OOM process.

Node Recovery

ClusterControl is able to recover a database node in case of intermittent failure by monitoring the process and connectivity to the database nodes. For the process, it works similarly to systemd, where it will make sure the MySQL service is started and running unless if you intentionally stopped it via ClusterControl UI.

If the node comes back online, ClusterControl will establish a connection back to the database node and will perform the necessary actions. The following is what ClusterControl would do to recover a node:

  • It will wait for systemd/chkconfig/init to start up the monitored services/processes for 30 seconds
  • If the monitored services/processes are still down, ClusterControl will try to start the database service automatically.
  • If ClusterControl is unable to recover the monitored services/processes, an alarm will be raised.

Note that if a database shutdown is initiated by user, ClusterControl will not attempt to recover the particular node. It expects the user to start it back via ClusterControl UI by going to Node -> Node Actions -> Start Node or use the OS command explicitly.

The recovery includes all database-related services like ProxySQL, HAProxy, MaxScale, Keepalived, Prometheus exporters and garbd. Special attention to Prometheus exporters where ClusterControl uses a program called "daemon" to daemonize the exporter process. ClusterControl will try to connect to exporter's listening port for health check and verification. Thus, it's recommended to open the exporter ports from ClusterControl and Prometheus server to make sure no false alarm during recovery.

Cluster Recovery

ClusterControl understands the database topology and follows best practices in performing the recovery. For a database cluster that comes with built-in fault tolerance like Galera Cluster, NDB Cluster and MongoDB Replicaset, the failover process will be performed automatically by the database server via quorum calculation, heartbeat and role switching (if any). ClusterControl monitors the process and make necessary adjustments to the visualization like reflecting the changes under Topology view and adjusting the monitoring and management component for the new role e.g, new primary node in a replica set.

For database technologies that do not have built-in fault tolerance with automatic recovery like MySQL/MariaDB Replication and PostgreSQL/TimescaleDB Streaming Replication, ClusterControl will perform the recovery procedures by following the best-practices provided by the database vendor. If the recovery fails, user intervention is required, and of course you will get an alarm notification regarding this.

In a mixed/hybrid topology, for example an asynchronous slave which is attached to a Galera Cluster or NDB Cluster, the node will be recovered by ClusterControl if cluster recovery is enabled.

Cluster recovery does not apply to standalone MySQL server. However, it's recommended to turn on both node and cluster recoveries for this cluster type in the ClusterControl UI.

MySQL/MariaDB Replication

ClusterControl supports recovery of the following MySQL/MariaDB replication setup:

  • Master-slave with MySQL GTID
  • Master-slave with MariaDB GTID
  • Master-slave with without GTID (both MySQL and MariaDB)
  • Master-master with MySQL GTID
  • Master-master with MariaDB GTID
  • Asynchronous slave attached to a Galera Cluster

ClusterControl will respect the following parameters when performing cluster recovery:

  • enable_cluster_autorecovery
  • auto_manage_readonly
  • repl_password
  • repl_user
  • replication_auto_rebuild_slave
  • replication_check_binlog_filtration_bf_failover
  • replication_check_external_bf_failover
  • replication_failed_reslave_failover_script
  • replication_failover_blacklist
  • replication_failover_events
  • replication_failover_wait_to_apply_timeout
  • replication_failover_whitelist
  • replication_onfail_failover_script
  • replication_post_failover_script
  • replication_post_switchover_script
  • replication_post_unsuccessful_failover_script
  • replication_pre_failover_script
  • replication_pre_switchover_script
  • replication_skip_apply_missing_txs
  • replication_stop_on_error

For more details on each of the parameter, refer to the documentation page.

ClusterControl will obey the following rules when monitoring and managing a master-slave replication:

  • All nodes will be started with read_only=ON and super_read_only=ON (regardless of its role).
  • Only one master (read_only=OFF) is allowed to operate at any given time.
  • Rely on MySQL variable report_host to map the topology.
  • If there are two or more nodes that have read_only=OFF at a time, ClusterControl will automatically set read_only=ON on both masters, to protect them against accidental writes. User intervention is required to pick the actual master by disabling the read-only. Go to Nodes -> Node Actions -> Disable Readonly.

In case the active master goes down, ClusterControl will attempt to perform the master failover in the following order:

  1. After 3 seconds of master unreachability, ClusterControl will raise an alarm.
  2. Check the slave availability, at least one of the slaves must be reachable by ClusterControl.
  3. Pick the slave as a candidate to be a master.
  4. ClusterControl will calculate the probability of errant transactions if GTID is enabled. 
  5. If no errant transaction is detected, the chosen will be promoted as the new master.
  6. Create and grant replication user to be used by slaves.
  7. Change master for all slaves that were pointing to the old master to the newly promoted master.
  8. Start slave and enable read only.
  9. Flush logs on all nodes.
  10. If the slave promotion fails, ClusterControl will abort the recovery job. User intervention or a cmon service restart is required to trigger the recovery job again.
  11. When old master is available again, it will be started as read-only and will not be part of the replication. User intervention is required.

At the same time, the following alarms will be raised:

Check out Introduction to Failover for MySQL Replication - the 101 Blog and Automatic Failover of MySQL Replication - New in ClusterControl 1.4 to get further information on how to configure and manage MySQL replication failover with ClusterControl.

PostgreSQL/TimescaleDB Streaming Replication

ClusterControl supports recovery of the following PostgreSQL replication setup:

ClusterControl will respect the following parameters when performing cluster recovery:

  • enable_cluster_autorecovery
  • repl_password
  • repl_user
  • replication_auto_rebuild_slave
  • replication_failover_whitelist
  • replication_failover_blacklist

For more details on each of the parameter, refer to the documentation page.

ClusterControl will obey the following rules for managing and monitoring a PostgreSQL streaming replication setup:

  • wal_level is set to "replica" (or "hot_standby" depending on the PostgreSQL version).
  • Variable archive_mode is set to ON on the master.
  • Set recovery.conf file on the slave nodes, which turns the node into a hot standby with read-only enabled.

In case if the active master goes down, ClusterControl will attempt to perform the cluster recovery in the following order:

  1. After 10 seconds of master unreachability, ClusterControl will raise an alarm.
  2. After 10 seconds of graceful waiting timeout, ClusterControl will initiate the master failover job.
  3. Sample the replayLocation and receiveLocation on all available nodes to determine the most advanced node.
  4. Promote the most advanced node as the new master.
  5. Stop slaves.
  6. Verify the synchronization state with pg_rewind.
  7. Restarting slaves with the new master.
  8. If the slave promotion fails, ClusterControl will abort the recovery job. User intervention or a cmon service restart is required to trigger the recovery job again.
  9. When old master is available again, it will be forced to shut down and will not be part of the replication. User intervention is required. See further down.

When the old master comes back online, if PostgreSQL service is running, ClusterControl will force shutdown of the PostgreSQL service. This is to protect the server from accidental writes, since it would be started without a recovery file (recovery.conf), which means it would be writable. You should expect the following lines will appear in postgresql-{day}.log:

2019-11-27 05:06:10.091 UTC [2392] LOG:  database system is ready to accept connections

2019-11-27 05:06:27.696 UTC [2392] LOG:  received fast shutdown request

2019-11-27 05:06:27.700 UTC [2392] LOG:  aborting any active transactions

2019-11-27 05:06:27.703 UTC [2766] FATAL:  terminating connection due to administrator command

2019-11-27 05:06:27.704 UTC [2758] FATAL:  terminating connection due to administrator command

2019-11-27 05:06:27.709 UTC [2392] LOG:  background worker "logical replication launcher" (PID 2419) exited with exit code 1

2019-11-27 05:06:27.709 UTC [2414] LOG:  shutting down

2019-11-27 05:06:27.735 UTC [2392] LOG:  database system is shut down

The PostgreSQL was started after the server was back online around 05:06:10 but ClusterControl performs a fast shutdown 17 seconds after that around 05:06:27. If this is something that you would not want it to be, you can disable node recovery for this cluster momentarily.

Check out Automatic Failover of Postgres Replication and Failover for PostgreSQL Replication 101 to get further information on how to configure and manage PostgreSQL replication failover with ClusterControl.

Conclusion

ClusterControl automatic recovery understands database cluster topology and is able to recover a down or degraded cluster to a fully operational cluster which will improve the database service uptime tremendously. Try ClusterControl now and achieve your nines in SLA and database availability. Don't know your nines? Check out this cool nines calculator.

ClusterControl CMON HA for Distributed Database High Availability - Part One (Installation)

$
0
0

High Availability is a paramount nowadays and there’s no better way to introduce high availability than to build it on top of the quorum-based cluster. Such cluster is able to easily handle failures of individual nodes and ensure that all nodes, which have disconnected from the cluster, will not continue to operate. There are several protocols that allow you to solve consensus issues, examples being Paxos or RAFT. You can always introduce your own code. 

With this in mind, we would like to introduce you to CMON HA, a solution we created which allows to build highly available clusters of cmon daemons to achieve ClusterControl high availability. Please keep in mind this is a beta feature - it works but we are adding better debugging and more usability features. Having said that, let’s take a look at how it can be deployed, configured and accessed.

Prerequisites

CMON, the daemon that executes tasks in ClusterControl, works with a MySQL database to store some of the data - configuration settings, metrics, backup schedules and many others. In the typical setup this is a standalone MySQL instance. As we want to build highly available solution, we have to consider highly available database backend as well. One of the common solutions for that is MySQL Galera Cluster. As the installation scripts for ClusterControl sets up the standalone database, we have to deploy our Galera Cluster first, before we attempt to install highly available ClusterControl. What is the better way of deploying a Galera cluster than using ClusterControl? We will use temporary ClusterControl to deploy Galera on top of which we will deploy highly available version of ClusterControl.

Deploying a MySQL Galera Cluster

We won’t cover here the installation of the standalone ClusterControl. It’s as easy as downloading it for free and then following the steps you are provided with. Once it is ready, you can use the deployment wizard to deploy 3 nodes of Galera Cluster in couple of minutes.

Pick the deployment option, you will be then presented with a deployment wizard.

Define SSH connectivity details. You can use either root or password or passwordless sudo user. Make sure you correctly set SSH port and path to the SSH key.

Then you should pick a vendor, version and few of the configuration details including server port and root password. Finally, define the nodes you want to deploy your cluster on. Once this is done, ClusterControl will deploy a Galera cluster on the nodes you picked. From now on you can as well remove this ClusterControl instance, it won’t be needed anymore.

Deploying a Highly Available ClusterControl Installation

We are going to start with one node, configure it to start the cluster and then we will proceed with adding additional nodes.

Enabling Clustered Mode on the First Node

What we want to do is to deploy a normal ClusterControl instance therefore we are going to proceed with typical installation steps. We can download the installation script and then run it. The main difference, compared to the steps we took when we installed a temporary ClusterControl to deploy Galera Cluster, is that in this case there is already existing MySQL database. Thus the script will detect it, ask if we want to use it and if so, request password for the superuser. Other than that, installation is basically the same.

Next step would be to reconfigure cmon to listen not only on the localhost but also to bind to IP’s that can be accessed from outside. Communication between nodes in the cluster will happen on that IP on port (by default) 9501. We can accomplish this by editing file: /etc/default/cmon and adding IP to the RPC_BIND_ADDRESSES variable:

RPC_BIND_ADDRESSES="127.0.0.1,10.0.0.101"

Afterwards we have to restart cmon service:

service cmon restart

Following step will be to configure s9s CLI tools, which we will use to create and monitor cmon HA cluster. As per the documentation, those are the steps to take:

wget http://repo.severalnines.com/s9s-tools/install-s9s-tools.sh

chmod 755 install-s9s-tools.sh

./install-s9s-tools.sh

Once we have s9s tools installed, we can enable the clustered mode for cmon:

s9s controller --enable-cmon-ha

We can then verify the state of the cluster:

s9s controller --list --long

S VERSION    OWNER GROUP NAME            IP PORT COMMENT

l 1.7.4.3565 system admins 10.0.0.101      10.0.0.101 9501 Acting as leader.

Total: 1 controller(s)

As you can see, we have one node up and it is acting as a leader. Obviously, we need at least three nodes to be fault-tolerant therefore the next step will be to set up the remaining nodes.

Enabling Clustered Mode on Remaining Nodes

There are a couple of things we have to keep in mind while setting up additional nodes. First of all, ClusterControl creates tokens that “links” cmon daemon with clusters. That information is stored in several locations, including in the cmon database therefore we have to ensure every place contains the same token. Otherwise cmon nodes won’t be able to collect information about clusters and execute RPC calls. To do that we should copy existing configuration files from the first node to the other nodes. In this example we’ll use node with IP of 10.0.0.103 but you should do that for every node you plan to include in the cluster.

We’ll start by copying the cmon configuration files to new node:

scp -r /etc/cmon* 10.0.0.103:/etc/

We may need to edit /etc/cmon.cnf and set the proper hostname:

hostname=10.0.0.103

Then we’ll proceed with regular installation of the cmon, just like we did on the first node. There is one main difference though. Script will detect configuration files and ask if we want to install the controller:

=> An existing Controller installation detected!

=> A re-installation of the Controller will overwrite the /etc/cmon.cnf file

=> Install the Controller? (y/N):

We don’t want to do it for now. As on the first node we will be asked if we want to use existing MySQL database. We do want that. Then we’ll be asked to provide passwords:

=> Enter your MySQL root user's password:

=> Set a password for ClusterControl's MySQL user (cmon) [cmon]

=> Supported special characters: ~!@#$%^&*()_+{}<>?

=> Enter a CMON user password:

=> Enter the CMON user password again: => Creating the MySQL cmon user ...

Please make sure you use exactly the same password for cmon user as you did on the first node.

As the next step, we want to install s9s tools on new nodes:

wget http://repo.severalnines.com/s9s-tools/install-s9s-tools.sh

chmod 755 install-s9s-tools.sh

./install-s9s-tools.sh

We want to have them configured exactly as on the first node thus we’ll copy the config:

scp -r ~/.s9s/ 10.0.0.103:/root/

scp /etc/s9s.conf 10.0.0.103:/etc/

There’s one more place where we ClusterControl stores token: /var/www/clustercontrol/bootstrap.php. We want to copy that file as well:

scp /var/www/clustercontrol/bootstrap.php 10.0.0.103:/var/www/clustercontrol/

Finally, we want to install the controller (as we skipped this when we ran the installation script):

apt install clustercontrol-controller

Make sure you do not overwrite existing configuration files. Default options should be safe and leave correct configuration files in place.

There is one more piece of configuration you may want to copy: /etc/default/cmon. You want to copy it to other nodes:

scp /etc/default/cmon 10.0.0.103:/etc/default

Then you want to edit RPC_BIND_ADDRESSES to point to a correct IP of the node.

RPC_BIND_ADDRESSES="127.0.0.1,10.0.0.103"

Then we can start the cmon service on the nodes, one by one, and see if they managed to join the cluster. If everything went well, you should see something like this:

s9s controller --list --long

S VERSION    OWNER GROUP NAME            IP PORT COMMENT

l 1.7.4.3565 system admins 10.0.0.101      10.0.0.101 9501 Acting as leader.

f 1.7.4.3565 system admins 10.0.0.102      10.0.0.102 9501 Accepting heartbeats.

f 1.7.4.3565 system admins 10.0.0.103      10.0.0.103 9501 Accepting heartbeats.

Total: 3 controller(s)

In case of any issues, please check if all the cmon services are bound to the correct IP addresses. If not, kill them and start again, to re-read the proper configuration:

root      8016 0.4 2.2 658616 17124 ?        Ssl 09:16 0:00 /usr/sbin/cmon --rpc-port=9500 --bind-addr='127.0.0.1,10.0.0.103' --events-client='http://127.0.0.1:9510' --cloud-service='http://127.0.0.1:9518'

If you manage to see the output from ‘s9s controller --list --long’ as above, this means that, technically, we have a running cmon HA cluster of three nodes. We can end here but it’s not over yet. The main problem that remains is the UI access. Only leader node can execute jobs. Some of the s9s commands support this but as of now UI does not. This means that the UI will work only on the leader node, in our current situation it is the UI accessible via https://10.0.0.101/clustercontrol

In the second part we will show you one of the ways in which you could solve this problem.


ClusterControl CMON HA for Distributed Database High Availability - Part Two (GUI Access Setup)

$
0
0

In the first part, we ended up with a working cmon HA cluster:

root@vagrant:~# s9s controller --list --long

S VERSION    OWNER GROUP NAME            IP PORT COMMENT

l 1.7.4.3565 system admins 10.0.0.101      10.0.0.101 9501 Acting as leader.

f 1.7.4.3565 system admins 10.0.0.102      10.0.0.102 9501 Accepting heartbeats.

f 1.7.4.3565 system admins 10.0.0.103      10.0.0.103 9501 Accepting heartbeats.

Total: 3 controller(s)

We have three nodes up and running, one is acting as a leader and remaining are followers, which are accessible (they do receive heartbeats and reply to them). The remaining challenge is to configure UI access in a way that will allow us to always access the UI on the leader node. In this blog post we will present one of the possible solutions which will allow you to accomplish just that.

Setting up HAProxy

This problem is not new to us. With every replication cluster, MySQL or PostgreSQL, it doesn’t matter,  there’s a single node where we should send our writes to. One way of accomplishing that would be to use HAProxy and add some external checks that test the state of the node, and based on that, return proper values. This is basically what we are going to use to solve our problem. We will use HAProxy as a well-tested layer 4 proxy and we will combine it with layer 7 HTTP checks that we will write precisely for our use case. First things first, let’s install HAProxy. We will collocate it with ClusterControl, but it can as well be installed on a separate node (ideally, nodes - to remove HAProxy as the single point of failure).

apt install haproxy

This sets up HAProxy. Once it’s done, we have to introduce our configuration:

global

        pidfile /var/run/haproxy.pid

        daemon

        user haproxy

        group haproxy

        stats socket /var/run/haproxy.socket user haproxy group haproxy mode 600 level admin

        node haproxy_10.0.0.101

        description haproxy server


        #* Performance Tuning

        maxconn 8192

        spread-checks 3

        quiet

defaults

        #log    global

        mode    tcp

        option  dontlognull

        option tcp-smart-accept

        option tcp-smart-connect

        #option dontlog-normal

        retries 3

        option redispatch

        maxconn 8192

        timeout check   10s

        timeout queue   3500ms

        timeout connect 3500ms

        timeout client  10800s

        timeout server  10800s


userlist STATSUSERS

        group admin users admin

        user admin insecure-password admin

        user stats insecure-password admin


listen admin_page

        bind *:9600

        mode http

        stats enable

        stats refresh 60s

        stats uri /

        acl AuthOkay_ReadOnly http_auth(STATSUSERS)

        acl AuthOkay_Admin http_auth_group(STATSUSERS) admin

        stats http-request auth realm admin_page unless AuthOkay_ReadOnly

        #stats admin if AuthOkay_Admin


listen  haproxy_10.0.0.101_81

        bind *:81

        mode tcp

        tcp-check connect port 80

        timeout client  10800s

        timeout server  10800s

        balance leastconn

        option httpchk

#        option allbackups

        default-server port 9201 inter 20s downinter 30s rise 2 fall 2 slowstart 60s maxconn 64 maxqueue 128 weight 100

        server 10.0.0.101 10.0.0.101:443 check

        server 10.0.0.102 10.0.0.102:443 check

        server 10.0.0.103 10.0.0.103:443 check

You may want to change some of the things here like the node or backend names which include here the IP of our node. You will definitely want to change servers that you are going to have included in your HAProxy.

The most important bits are:

        bind *:81

HAProxy will listen on port 81.

        option httpchk

We have enabled layer 7 check on the backend nodes.

        default-server port 9201 inter 20s downinter 30s rise 2 fall 2 slowstart 60s maxconn 64 maxqueue 128 weight 100

The layer 7 check will be executed on port 9201.

Once this is done, start HAProxy.

Setting up xinetd and Check Script

We are going to use xinetd to execute the check and return correct responses to HAProxy. Steps described in this paragraph should be executed on all cmon HA cluster nodes.

First, install xinetd:

root@vagrant:~# apt install xinetd

Once this is done, we have to add the following line:

cmonhachk       9201/tcp

to /etc/services - this will allow xinetd to open a service that will listen on port 9201. Then we have to add the service file itself. It should be located in /etc/xinetd.d/cmonhachk:

# default: on

# description: cmonhachk

service cmonhachk

{

        flags           = REUSE

        socket_type     = stream

        port            = 9201

        wait            = no

        user            = root

        server          = /usr/local/sbin/cmonhachk.py

        log_on_failure  += USERID

        disable         = no

        #only_from       = 0.0.0.0/0

        only_from       = 0.0.0.0/0

        per_source      = UNLIMITED

}

Finally, we need the check script that’s called by the xinetd. As defined in the service file it is located in /usr/local/sbin/cmonhachk.py.

#!/usr/bin/python3.5


import subprocess

import re

import sys

from pathlib import Path

import os


def ret_leader():

    leader_str = """HTTP/1.1 200 OK\r\n

Content-Type: text/html\r\n

Content-Length: 48\r\n

\r\n

<html><body>This node is a leader.</body></html>\r\n

\r\n"""

    print(leader_str)


def ret_follower():

    follower_str = """

HTTP/1.1 503 Service Unavailable\r\n

Content-Type: text/html\r\n

Content-Length: 50\r\n

\r\n

<html><body>This node is a follower.</body></html>\r\n

\r\n"""

    print(follower_str)


def ret_unknown():

    unknown_str = """

HTTP/1.1 503 Service Unavailable\r\n

Content-Type: text/html\r\n

Content-Length: 59\r\n

\r\n

<html><body>This node is in an unknown state.</body></html>\r\n

\r\n"""

    print(unknown_str)


lockfile = "/tmp/cmonhachk_lockfile"


if os.path.exists(lockfile):

    print("Lock file {} exists, exiting...".format(lockfile))

    sys.exit(1)


Path(lockfile).touch()

try:

    with open("/etc/default/cmon", 'r') as f:

        lines  = f.readlines()


    pattern1 = "RPC_BIND_ADDRESSES"

    pattern2 = "[0-9]{1,3}\.[0-9]{1,3}\.[0-9]{1,3}\.[0-9]{1,3}"

    m1 = re.compile(pattern1)

    m2 = re.compile(pattern2)


    for line in lines:

        res1 = m1.match(line)

        if res1 is not None:

            res2 = m2.findall(line)

            i = 0

            for r in res2:

                if r != "127.0.0.1" and i == 0:

                    i += 1

                    hostname = r


    command = "s9s controller --list --long | grep {}".format(hostname)

    output = subprocess.check_output(command.split())

    state = output.splitlines()[1].decode('UTF-8')[0]

    if state == "l":

        ret_leader()

    if state == "f":

        ret_follower()

    else:

        ret_unknown()

finally:

    os.remove(lockfile)

Once you create the file, make sure it is executable:

chmod u+x /usr/local/sbin/cmonhachk.py

The idea behind this script is that it tests the status of the nodes using “s9s controller --list --long” command and then it checks the output relevant to the IP that it can find on the local node. This allows the script to determine if the host on which it is executed is a leader or not. If the node is the leader, script returns “HTTP/1.1 200 OK” code, which HAProxy interprets as the node is available and routes the traffic to it.. Otherwise it returns “HTTP/1.1 503 Service Unavailable”, which is treated as a node, which is not healthy and the traffic will not be routed there. As a result, no matter which node will become a leader, HAProxy will detect it and mark it as available in the backend:

You may need to restart HAProxy and xinetd to apply configuration changes before all the parts will start working correctly.

Having more than one HAProxy ensures we have a way to access ClusterControl UI even if one of HAProxy nodes would fail but we still have two (or more) different hostnames or IP to connect to the ClusterControl UI. To make it more comfortable, we will deploy Keepalived on top of HAProxy. It will monitor the state of HAProxy services and assign Virtual IP to one of them. If that HAProxy would become unavailable, VIP will be moved to another available HAProxy. As a result, we’ll have a single point of entry (VIP or a hostname associated to it). The steps we’ll take here have to be executed on all of the nodes where HAProxy has been installed.

First, let’s install keepalived:

apt install keepalived

Then we have to configure it. We’ll use following config file:

vrrp_script chk_haproxy {

   script "killall -0 haproxy"   # verify the pid existance

   interval 2                    # check every 2 seconds

   weight 2                      # add 2 points of prio if OK

}

vrrp_instance VI_HAPROXY {

   interface eth1                # interface to monitor

   state MASTER

   virtual_router_id 51          # Assign one ID for this route

   priority 102                   

   unicast_src_ip 10.0.0.101

   unicast_peer {

      10.0.0.102

10.0.0.103


   }

   virtual_ipaddress {

       10.0.0.130                        # the virtual IP

   } 

   track_script {

       chk_haproxy

   }

#    notify /usr/local/bin/notify_keepalived.sh

}

You should modify this file on different nodes. IP addresses have to be configured properly and priority should be different on all of the nodes. Please also configure VIP that makes sense in your network. You may also want to change the interface - we used eth1, which is where the IP is assigned on virtual machines created by Vagrant.

Start the keepalived with this configuration file and you should be good to go. As long as VIP is up on one HAProxy node, you should be able to use it to connect to the proper ClusterControl UI:

This completes our two-part introduction to ClusterControl highly available clusters. As we stated at the beginning, this is still in beta state but we are looking forward for feedback from your tests.

Maximizing Database Query Efficiency for MySQL - Part One

$
0
0

Slow queries, inefficient queries, or long running queries are problems that regularly plague DBA's. They are always ubiquitous, yet are an inevitable part of life for anyone responsible for managing a database. 

Poor database design can affect the efficiency of the query and its performance. Lack of knowledge or improper use of function calls, stored procedures, or routines can also cause database performance degradation and can even harm the entire MySQL database cluster

For a master-slave replication, a very common cause of these issues are tables which lack primary or secondary indexes. This causes slave lag which can last for a very long time (in a worse case scenario).

In this two-part series blog, we'll give you a refresher course on how to tackle the maximizing of your database queries in MySQL to driver better efficiency and performance.

Always Add a Unique Index To Your Table

Tables that do not have primary or unique keys typically create huge problems when data gets bigger. When this happens a simple data modification can stall the database. Lack of proper indices and an UPDATE or DELETE statement has been applied to the particular table, a full table scan will be chosen as the query plan by MySQL. That can cause high disk I/O for reads and writes and degrades the performance of your database. See an example below:

root[test]> show create table sbtest2\G

*************************** 1. row ***************************

       Table: sbtest2

Create Table: CREATE TABLE `sbtest2` (

  `id` int(10) unsigned NOT NULL,

  `k` int(10) unsigned NOT NULL DEFAULT '0',

  `c` char(120) NOT NULL DEFAULT '',

  `pad` char(60) NOT NULL DEFAULT ''

) ENGINE=InnoDB DEFAULT CHARSET=latin1

1 row in set (0.00 sec)


root[test]> explain extended update sbtest2 set k=52, pad="xx234xh1jdkHdj234" where id=57;

+----+-------------+---------+------------+------+---------------+------+---------+------+---------+----------+-------------+

| id | select_type | table   | partitions | type | possible_keys | key  | key_len | ref | rows | filtered | Extra       |

+----+-------------+---------+------------+------+---------------+------+---------+------+---------+----------+-------------+

|  1 | UPDATE      | sbtest2 | NULL       | ALL | NULL | NULL | NULL    | NULL | 1923216 | 100.00 | Using where |

+----+-------------+---------+------------+------+---------------+------+---------+------+---------+----------+-------------+

1 row in set, 1 warning (0.06 sec)

Whereas a table with primary key has a very good query plan,

root[test]> show create table sbtest3\G

*************************** 1. row ***************************

       Table: sbtest3

Create Table: CREATE TABLE `sbtest3` (

  `id` int(10) unsigned NOT NULL AUTO_INCREMENT,

  `k` int(10) unsigned NOT NULL DEFAULT '0',

  `c` char(120) NOT NULL DEFAULT '',

  `pad` char(60) NOT NULL DEFAULT '',

  PRIMARY KEY (`id`),

  KEY `k` (`k`)

) ENGINE=InnoDB AUTO_INCREMENT=2097121 DEFAULT CHARSET=latin1

1 row in set (0.00 sec)


root[test]> explain extended update sbtest3 set k=52, pad="xx234xh1jdkHdj234" where id=57;

+----+-------------+---------+------------+-------+---------------+---------+---------+-------+------+----------+-------------+

| id | select_type | table   | partitions | type | possible_keys | key     | key_len | ref | rows | filtered | Extra   |

+----+-------------+---------+------------+-------+---------------+---------+---------+-------+------+----------+-------------+

|  1 | UPDATE      | sbtest3 | NULL       | range | PRIMARY | PRIMARY | 4       | const | 1 | 100.00 | Using where |

+----+-------------+---------+------------+-------+---------------+---------+---------+-------+------+----------+-------------+

1 row in set, 1 warning (0.00 sec)

Primary or unique keys provides vital component for a table structure because this is very important especially when performing maintenance on a table. For example, using tools from the Percona Toolkit (such as pt-online-schema-change or pt-table-sync) recommends that you must have unique keys. Keep in mind that the PRIMARY KEY is already a unique key and a primary key cannot hold NULL values but unique key. Assigning a NULL value to a Primary Key can cause an error like,

ERROR 1171 (42000): All parts of a PRIMARY KEY must be NOT NULL; if you need NULL in a key, use UNIQUE instead

For slave nodes, it is also common that in certain occasions, the primary/unique key is not present on the table which therefore are discrepancy of the table structure. You can use mysqldiff to achieve this or you can mysqldump --no-data … params and and run a diff to compare its table structure and check if there's any discrepancy. 

Scan Tables With Duplicate Indexes, Then Dropped It

Duplicate indices can also cause performance degradation, especially when the table contains a huge number of records. MySQL has to perform multiple attempts to optimize the query and performs more query plans to check. It includes scanning large index distribution or statistics and that adds performance overhead as it can cause memory contention or high I/O memory utilization.

Degradation for queries when duplicate indices are observed on a table also attributes on saturating the buffer pool. This can also affect the performance of MySQL when the checkpointing flushes the transaction logs into the disk. This is due to the processing and storing of an unwanted index (which is in fact a waste of space in the particular tablespace of that table). Take note that duplicate indices are also stored in the tablespace which also has to be stored in the buffer pool. 

Take a look at the table below which contains multiple duplicate keys:

root[test]#> show create table sbtest3\G

*************************** 1. row ***************************

       Table: sbtest3

Create Table: CREATE TABLE `sbtest3` (

  `id` int(10) unsigned NOT NULL AUTO_INCREMENT,

  `k` int(10) unsigned NOT NULL DEFAULT '0',

  `c` char(120) NOT NULL DEFAULT '',

  `pad` char(60) NOT NULL DEFAULT '',

  PRIMARY KEY (`id`),

  KEY `k` (`k`,`pad`,`c`),

  KEY `kcp2` (`id`,`k`,`c`,`pad`),

  KEY `kcp` (`k`,`c`,`pad`),

  KEY `pck` (`pad`,`c`,`id`,`k`)

) ENGINE=InnoDB AUTO_INCREMENT=2048561 DEFAULT CHARSET=latin1

1 row in set (0.00 sec)

and has a size of 2.3GiB

root[test]#> \! du -hs /var/lib/mysql/test/sbtest3.ibd

2.3G    /var/lib/mysql/test/sbtest3.ibd

Let's drop the duplicate indices and rebuild the table with a no-op alter,

root[test]#> drop index kcp2 on sbtest3; drop index kcp on sbtest3 drop index pck on sbtest3;

Query OK, 0 rows affected (0.01 sec)

Records: 0  Duplicates: 0  Warnings: 0

Query OK, 0 rows affected (0.01 sec)

Records: 0  Duplicates: 0  Warnings: 0

Query OK, 0 rows affected (0.01 sec)

Records: 0  Duplicates: 0  Warnings: 0


root[test]#> alter table sbtest3 engine=innodb;

Query OK, 0 rows affected (28.23 sec)

Records: 0  Duplicates: 0  Warnings: 0


root[test]#> \! du -hs /var/lib/mysql/test/sbtest3.ibd

945M    /var/lib/mysql/test/sbtest3.ibd

It has been able to save up to ~59% of the old size of the table space which is really huge.

To determine duplicate indexes, you can use pt-duplicate-checker to handle the job for you. 

Tune Up your Buffer Pool

For this section I’m referring only to the InnoDB storage engine. 

Buffer pool is an important component within the InnoDB kernel space. This is where InnoDB caches table and index data when accessed. It speeds up processing because frequently used data are being stored in the memory efficiently using BTREE. For instance, If you have multiple tables consisting of >= 100GiB and are accessed heavily, then we suggest that you delegate a fast volatile memory starting from a size of 128GiB and start assigning the buffer pool with 80% of the physical memory. The 80% has to be monitored efficiently. You can use SHOW ENGINE INNODB STATUS \G or you can leverage monitoring software such as ClusterControl which offers a fine-grained monitoring which includes buffer pool and its relevant health metrics. Also set the innodb_buffer_pool_instances variable accordingly. You might set this larger than 8 (default if innodb_buffer_pool_size >= 1GiB), such as 16, 24, 32, or 64 or higher if necessary.  

When monitoring the buffer pool, you need to check global status variable Innodb_buffer_pool_pages_free which provides you thoughts if there's a need to adjust the buffer pool, or maybe consider if there are also unwanted or duplicate indexes that consumes the buffer. The SHOW ENGINE INNODB STATUS \G also offers a more detailed aspect of the buffer pool information including its individual buffer pool based on the number of innodb_buffer_pool_instances you have set.

Use FULLTEXT Indexes (But Only If Applicable)

Using queries like,

SELECT bookid, page, context FROM books WHERE context like '%for dummies%';

wherein context is a string-type (char, varchar, text) column, is an example of a super bad query! Pulling large content of records with a filter that has to be greedy ends up with a full table scan, and that is just crazy. Consider using FULLTEXT index. A FULLTEXT indexes have an inverted index design. Inverted indexes store a list of words, and for each word, a list of documents that the word appears in. To support proximity search, position information for each word is also stored, as a byte offset.

In order to use FULLTEXT for searching or filtering data, you need to use the combination of MATCH() ...AGAINST syntax and not like the query above. Of course, you need to specify the field to be your FULLTEXT index field. 

To create a FULLTEXT index, just specify with FULLTEXT as your index. See the example below:

root[minime]#> CREATE FULLTEXT INDEX aboutme_fts ON users_info(aboutme);

Query OK, 0 rows affected, 1 warning (0.49 sec)

Records: 0  Duplicates: 0  Warnings: 1


root[jbmrcd_date]#> show warnings;

+---------+------+--------------------------------------------------+

| Level   | Code | Message                                          |

+---------+------+--------------------------------------------------+

| Warning |  124 | InnoDB rebuilding table to add column FTS_DOC_ID |

+---------+------+--------------------------------------------------+

1 row in set (0.00 sec)

Although using FULLTEXT indexes can offer benefits when searching words within a very large context inside a column, it also creates issues when used incorrectly. 

When doing a FULLTEXT search for a large table that is constantly accessed (where a number of client requests are searching for different,  unique keywords) it could be very CPU intensive. 

There are certain occasions as well that FULLTEXT is not applicable. See this external blog post. Although I haven't tried this with 8.0, I don't see any changes relevant to this. We suggest that do not use FULLTEXT for searching a big data environment, especially for high-traffic tables. Otherwise, try to leverage other technologies such as Apache Lucene, Apache Solr, tsearch2, or Sphinx.

Avoid Using NULL in Columns

Columns that contain null values are totally fine in MySQL. But if you are using columns with null values into an index, it can affect query performance as the optimizer cannot provide the right query plan due to poor index distribution. However, there are certain ways to optimize queries that involves null values but of course, if this suits the requirements. Please check the documentation of MySQL about Null Optimization. You may also check this external post which is helpful as well.

Design Your Schema Topology and Tables Structure Efficiently

To some extent, normalizing your database tables from 1NF (First Normal Form) to 3NF (Third Normal Form) provides you some benefit for query efficiency because normalized tables tend to avoid redundant records. A proper planning and design for your tables is very important because this is how you retrieved or pull data and in every one of these actions has a cost. With normalized tables, the goal of the database is to ensure that every non-key column in every table is directly dependent on the key; the whole key and nothing but the key. If this goal is reached, it pays of the benefits in the form of reduced redundancies, fewer anomalies and improved efficiencies.

While normalizing your tables has many benefits, it doesn't mean you need to normalize all your tables in this way. You can implement a design for your database using Star Schema. Designing your tables using Star Schema has the benefit of simpler queries (avoid complex cross joins), easy to retrieve data for reporting, offers performance gains because there's no need to use unions or complex joins, or fast aggregations. A Star Schema is simple to implement, but you need to carefully plan because it can create big problems and disadvantages when your table gets bigger and requires maintenance. Star Schema (and its underlying tables) are prone to data integrity issues, so you may have a high probability that bunch of your data is redundant. If you think this table has to be constant (structure and design) and is designed to utilize query efficiency, then it's an ideal case for this approach.

Mixing your database designs (as long as you are able to determine and identify what kind of data has to be pulled on your tables) is very important since you can benefit with more efficient queries and as well as help the DBA with backups, maintenance, and recovery.

Get Rid of Constant and Old Data

We recently wrote some Best Practices for Archiving Your Database in the Cloud. It covers about how you can take advantage of data archiving before it goes to the cloud. So how does getting rid of old data or archiving your constant and old data help query efficiency? As stated in my previous blog, there are benefits for larger tables that are constantly modified and inserted with new data, the tablespace can grow quickly. MySQL and InnoDB performs efficiently when records or data are contiguous to each other and has significance to its next row in the table. Meaning, if you have no old records that are no longer need to be used, then the optimizer does not need to include that in the statistics offering much more efficient result. Make sense, right? And also, query efficiency is not only on the application side, it has also need to consider its efficiency when performing a backup and when on maintenance or failover. For example, if you have a bad and long query that can affect your maintenance period or a failover, that can be a problem.

Enable Query Logging As Needed

Always set your MySQL's slow query log in accordance to your custom needs. If you are using Percona Server, you can take advantage of their extended slow query logging. It allows you to customarily define certain variables. You can filter types of queries in combination such as full_scan, full_join, tmp_table, etc. You can also dictate the rate of slow query logging through variable log_slow_rate_type, and many others.

The importance of enabling query logging in MySQL (such as slow query) is beneficial for inspecting your queries so that you can optimize or tune your MySQL by adjusting certain variables that suits to your requirements. To enable slow query log, ensure that these variables are setup:

  • long_query_time - assign the right value for how long the queries can take. If the queries take more than 10 seconds (default), it will fall down to the slow query log file you assigned.
  • slow_query_log - to enable it, set it to 1.
  • slow_query_log_file - this is the destination path for your slow query log file.

The slow query log is very helpful for query analysis and diagnosing bad queries that cause stalls, slave delays, long running queries, memory or CPU intensive, or even cause the server to crash. If you use pt-query-digest or pt-index-usage, use the slow query log file as your source target for reporting these queries alike.

Conclusion

We have discussed some ways you can use to maximize database query efficiency in this blog. In this next part we'll discuss even more factors which can help you maximize performance. Stay tuned!


Maximizing Database Query Efficiency for MySQL - Part Two

$
0
0

This is the second part of a two-part series blog for Maximizing Database Query Efficiency In MySQL. You can read part one here.

Using Single-Column, Composite, Prefix, and Covering Index

Tables that are frequently receiving high traffic must be properly indexed. It's not only important to index your table, but you also need to determine and analyze what are the types of queries or types of retrieval that you need for the specific table. It is strongly recommended that you analyze what type of queries or retrieval of data you need on a specific table before you decide what indexes are required for the table. Let's go over these types of indexes and how you can use them to maximize your query performance.

Single-Column Index

InnoD table can contain a maximum of 64 secondary indexes. A single-column index (or full-column index) is an index assigned only to a particular column. Creating an index to a particular column that contains distinct values is a good candidate. A good index must have a high cardinality and statistics so the optimizer can choose the right query plan. To view the distribution of indexes, you can check with SHOW INDEXES syntax just like below:

root[test]#> SHOW INDEXES FROM users_account\G

*************************** 1. row ***************************

        Table: users_account

   Non_unique: 0

     Key_name: PRIMARY

 Seq_in_index: 1

  Column_name: id

    Collation: A

  Cardinality: 131232

     Sub_part: NULL

       Packed: NULL

         Null: 

   Index_type: BTREE

      Comment: 

Index_comment: 

*************************** 2. row ***************************

        Table: users_account

   Non_unique: 1

     Key_name: name

 Seq_in_index: 1

  Column_name: last_name

    Collation: A

  Cardinality: 8995

     Sub_part: NULL

       Packed: NULL

         Null: 

   Index_type: BTREE

      Comment: 

Index_comment: 

*************************** 3. row ***************************

        Table: users_account

   Non_unique: 1

     Key_name: name

 Seq_in_index: 2

  Column_name: first_name

    Collation: A

  Cardinality: 131232

     Sub_part: NULL

       Packed: NULL

         Null: 

   Index_type: BTREE

      Comment: 

Index_comment: 

3 rows in set (0.00 sec)

You can inspect as well with tablesinformation_schema.index_statistics or mysql.innodb_index_stats.

Compound (Composite) or Multi-Part Indexes

A compound index (commonly called a composite index) is a multi-part index composed of multiple columns. MySQL allows up to 16 columns bounded for a specific composite index. Exceeding the limit returns an error like below:

ERROR 1070 (42000): Too many key parts specified; max 16 parts allowed

A composite index provides a boost to your queries, but it requires that you must have a pure understanding on how you are retrieving the data. For example, a table with a DDL of...

CREATE TABLE `user_account` (

  `id` int(11) NOT NULL AUTO_INCREMENT,

  `last_name` char(30) NOT NULL,

  `first_name` char(30) NOT NULL,

  `dob` date DEFAULT NULL,

  `zip` varchar(10) DEFAULT NULL,

  `city` varchar(100) DEFAULT NULL,

  `state` varchar(100) DEFAULT NULL,

  `country` varchar(50) NOT NULL,

  `tel` varchar(16) DEFAULT NULL

  PRIMARY KEY (`id`),

  KEY `name` (`last_name`,`first_name`)

) ENGINE=InnoDB DEFAULT CHARSET=latin1

...which consists of composite index `name`. The composite index improves query performance once these keys are reference as used key parts. For example, see the following:

root[test]#> explain format=json select * from users_account where last_name='Namuag' and first_name='Maximus'\G

*************************** 1. row ***************************

EXPLAIN: {

  "query_block": {

    "select_id": 1,

    "cost_info": {

      "query_cost": "1.20"

    },

    "table": {

      "table_name": "users_account",

      "access_type": "ref",

      "possible_keys": [

        "name"

      ],

      "key": "name",

      "used_key_parts": [

        "last_name",

        "first_name"

      ],

      "key_length": "60",

      "ref": [

        "const",

        "const"

      ],

      "rows_examined_per_scan": 1,

      "rows_produced_per_join": 1,

      "filtered": "100.00",

      "cost_info": {

        "read_cost": "1.00",

        "eval_cost": "0.20",

        "prefix_cost": "1.20",

        "data_read_per_join": "352"

      },

      "used_columns": [

        "id",

        "last_name",

        "first_name",

        "dob",

        "zip",

        "city",

        "state",

        "country",

        "tel"

      ]

    }

  }

}

1 row in set, 1 warning (0.00 sec

The used_key_parts show that the query plan has perfectly selected our desired columns covered in our composite index.

Composite indexing has its limitations as well. Certain conditions in the query cannot take all columns part of the key.

The documentation says, "The optimizer attempts to use additional key parts to determine the interval as long as the comparison operator is =, <=>, or IS NULL. If the operator is >, <, >=, <=, !=, <>, BETWEEN, or LIKE, the optimizer uses it but considers no more key parts. For the following expression, the optimizer uses = from the first comparison. It also uses >= from the second comparison but considers no further key parts and does not use the third comparison for interval construction…". Basically, this means that regardless you have composite index for two columns, a sample query below does not cover both fields:

root[test]#> explain format=json select * from users_account where last_name>='Zu' and first_name='Maximus'\G

*************************** 1. row ***************************

EXPLAIN: {

  "query_block": {

    "select_id": 1,

    "cost_info": {

      "query_cost": "34.61"

    },

    "table": {

      "table_name": "users_account",

      "access_type": "range",

      "possible_keys": [

        "name"

      ],

      "key": "name",

      "used_key_parts": [

        "last_name"

      ],

      "key_length": "60",

      "rows_examined_per_scan": 24,

      "rows_produced_per_join": 2,

      "filtered": "10.00",

      "index_condition": "((`test`.`users_account`.`first_name` = 'Maximus') and (`test`.`users_account`.`last_name` >= 'Zu'))",

      "cost_info": {

        "read_cost": "34.13",

        "eval_cost": "0.48",

        "prefix_cost": "34.61",

        "data_read_per_join": "844"

      },

      "used_columns": [

        "id",

        "last_name",

        "first_name",

        "dob",

        "zip",

        "city",

        "state",

        "country",

        "tel"

      ]

    }

  }

}

1 row in set, 1 warning (0.00 sec)

In this case (and if your query is more of ranges instead of constant or reference types) then avoid using composite indexes. It just wastes your memory and buffer and it increases the performance degradation of your queries.

Prefix Indexes

Prefix indexes are indexes which contain columns referenced as an index, but only takes the starting length defined to that column, and that portion (or prefix data) are the only part stored in the buffer. Prefix indexes can help lessen your buffer pool resources and also your disk space as it does not need to take the full-length of the column.What does this mean? Let's take an example. Let's compare the impact between full-length index versus the prefix index.

root[test]#> create index name on users_account(last_name, first_name);

Query OK, 0 rows affected (0.42 sec)

Records: 0  Duplicates: 0  Warnings: 0


root[test]#> \! du -hs /var/lib/mysql/test/users_account.*

12K     /var/lib/mysql/test/users_account.frm

36M     /var/lib/mysql/test/users_account.ibd

We created a full-length composite index which consumes a total of 36MiB tablespace for users_account table. Let's drop it and then add a prefix index.

root[test]#> drop index name on users_account;

Query OK, 0 rows affected (0.01 sec)

Records: 0  Duplicates: 0  Warnings: 0


root[test]#> alter table users_account engine=innodb;

Query OK, 0 rows affected (0.63 sec)

Records: 0  Duplicates: 0  Warnings: 0


root[test]#> \! du -hs /var/lib/mysql/test/users_account.*

12K     /var/lib/mysql/test/users_account.frm

24M     /var/lib/mysql/test/users_account.ibd


root[test]#> create index name on users_account(last_name(5), first_name(5));

Query OK, 0 rows affected (0.42 sec)

Records: 0  Duplicates: 0  Warnings: 0


root[test]#> \! du -hs /var/lib/mysql/test/users_account.*

12K     /var/lib/mysql/test/users_account.frm

28M     /var/lib/mysql/test/users_account.ibd

Using the prefix index, it holds up only to 28MiB and that's less than 8MiB than using full-length index. That's great to hear, but it doesn't mean that is performant and serves what you need. 

If you decide to add a prefix index, you must identify first what type of query for data retrieval you need. Creating a prefix index helps you utilize more efficiency with the buffer pool and so it does help with your query performance but you also need to know its limitation. For example, let's compare the performance when using a full-length index and a prefix index.

Let's create a full-length index using a composite index,

root[test]#> create index name on users_account(last_name, first_name);

Query OK, 0 rows affected (0.45 sec)

Records: 0  Duplicates: 0  Warnings: 0


root[test]#>  EXPLAIN format=json select last_name from users_account where last_name='Namuag' and first_name='Maximus Aleksandre' \G

*************************** 1. row ***************************

EXPLAIN: {

  "query_block": {

    "select_id": 1,

    "cost_info": {

      "query_cost": "1.61"

    },

    "table": {

      "table_name": "users_account",

      "access_type": "ref",

      "possible_keys": [

        "name"

      ],

      "key": "name",

      "used_key_parts": [

        "last_name",

        "first_name"

      ],

      "key_length": "60",

      "ref": [

        "const",

        "const"

      ],

      "rows_examined_per_scan": 3,

      "rows_produced_per_join": 3,

      "filtered": "100.00",

      "using_index": true,

      "cost_info": {

        "read_cost": "1.02",

        "eval_cost": "0.60",

        "prefix_cost": "1.62",

        "data_read_per_join": "1K"

      },

      "used_columns": [

        "last_name",

        "first_name"

      ]

    }

  }

}

1 row in set, 1 warning (0.00 sec)


root[test]#> flush status;

Query OK, 0 rows affected (0.02 sec)


root[test]#> pager cat -> /dev/null; select last_name from users_account where last_name='Namuag' and first_name='Maximus Aleksandre' \G

PAGER set to 'cat -> /dev/null'

3 rows in set (0.00 sec)


root[test]#> nopager; show status like 'Handler_read%';

PAGER set to stdout

+-----------------------+-------+

| Variable_name         | Value |

+-----------------------+-------+

| Handler_read_first    | 0 |

| Handler_read_key      | 1 |

| Handler_read_last     | 0 |

| Handler_read_next     | 3 |

| Handler_read_prev     | 0 |

| Handler_read_rnd      | 0 |

| Handler_read_rnd_next | 0     |

+-----------------------+-------+

7 rows in set (0.00 sec)

The result reveals that it's, in fact, using a covering index i.e "using_index": true and uses indexes properly, i.e. Handler_read_key is incremented and does an index scan as Handler_read_next is incremented.

Now, let's try using prefix index of the same approach,

root[test]#> create index name on users_account(last_name(5), first_name(5));

Query OK, 0 rows affected (0.22 sec)

Records: 0  Duplicates: 0  Warnings: 0


root[test]#>  EXPLAIN format=json select last_name from users_account where last_name='Namuag' and first_name='Maximus Aleksandre' \G

*************************** 1. row ***************************

EXPLAIN: {

  "query_block": {

    "select_id": 1,

    "cost_info": {

      "query_cost": "3.60"

    },

    "table": {

      "table_name": "users_account",

      "access_type": "ref",

      "possible_keys": [

        "name"

      ],

      "key": "name",

      "used_key_parts": [

        "last_name",

        "first_name"

      ],

      "key_length": "10",

      "ref": [

        "const",

        "const"

      ],

      "rows_examined_per_scan": 3,

      "rows_produced_per_join": 3,

      "filtered": "100.00",

      "cost_info": {

        "read_cost": "3.00",

        "eval_cost": "0.60",

        "prefix_cost": "3.60",

        "data_read_per_join": "1K"

      },

      "used_columns": [

        "last_name",

        "first_name"

      ],

      "attached_condition": "((`test`.`users_account`.`first_name` = 'Maximus Aleksandre') and (`test`.`users_account`.`last_name` = 'Namuag'))"

    }

  }

}

1 row in set, 1 warning (0.00 sec)


root[test]#> flush status;

Query OK, 0 rows affected (0.01 sec)


root[test]#> pager cat -> /dev/null; select last_name from users_account where last_name='Namuag' and first_name='Maximus Aleksandre' \G

PAGER set to 'cat -> /dev/null'

3 rows in set (0.00 sec)


root[test]#> nopager; show status like 'Handler_read%';

PAGER set to stdout

+-----------------------+-------+

| Variable_name         | Value |

+-----------------------+-------+

| Handler_read_first    | 0 |

| Handler_read_key      | 1 |

| Handler_read_last     | 0 |

| Handler_read_next     | 3 |

| Handler_read_prev     | 0 |

| Handler_read_rnd      | 0 |

| Handler_read_rnd_next | 0     |

+-----------------------+-------+

7 rows in set (0.00 sec)

MySQL reveals that it does use index properly but noticeably, there's a cost overhead compared to a full-length index. That's obvious and explainable, since the prefix index does not cover the whole length of the field values. Using a prefix index is not a replacement, nor an alternative, of full-length indexing. It can also create poor results when using the prefix index inappropriately. So you need to determine what type of query and data you need to retrieve.

Covering Indexes

Covering Indexes doesn't require any special syntax in MySQL. A covering index in InnoDB refers to the case when all fields selected in a query are covered by an index. It does not need to do a sequential read over the disk to read the data in the table but only use the data in the index, significantly speeding up the query. For example, our query earlier i.e. 

select last_name from users_account where last_name='Namuag' and first_name='Maximus Aleksandre' \G

As mentioned earlier, is a covering index. When you have a very well-planned tables upon storing your data and created index properly, try to make as possible that your queries are designed to leverage covering index so that you'll benefit the result. This can help you maximize the efficiency of your queries and result to a great performance.

Leverage Tools That Offer Advisors or Query Performance Monitoring

Organizations often initially tend to go first on github and find open-source software that can offer great benefits. For simple advisories that helps you optimize your queries, you can leverage the Percona Toolkit. For a MySQL DBA, the Percona Toolkit is like a swiss army knife. 

For operations, you need to analyze how you are using your indexes, you can use pt-index-usage

Pt-query-digest is also available and it can analyze MySQL queries from logs, processlist, and tcpdump. In fact, the most important tool that you have to use for analyzing and inspecting bad queries is pt-query-digest. Use this tool to aggregate similar queries together and report on those that consume the most execution time.

For archiving old records, you can use pt-archiver. Inspecting your database for duplicate indexes, take leverage on pt-duplicate-key-checker. You might also take advantage of pt-deadlock-logger. Although deadlocks is not a cause of an underperforming and inefficient query but a poor implementation, yet it impacts query inefficiency. If you need table maintenance and requires you to add indexes online without affecting the database traffic going to a particular table, then you can use pt-online-schema-change. Alternatively, you can use gh-ost, which is also very useful for schema migrations.

If you are looking for enterprise features, bundled with lots of features from query performance and monitoring, alarms and alerts, dashboards or metrics that helps you optimize your queries, and advisors, ClusterControl may be the tool for you. ClusterControl offers many features that show you Top Queries, Running Queries, and Query Outliers. Checkout this blog MySQL Query Performance Tuning which guides you how to be on par for monitoring your queries with ClusterControl.

Conclusion

As you've arrived at the ending part of our two-series blog. We covered here the factors that cause query degradation and how to resolve it in order to maximize your database queries. We also shared some tools that can benefit you and help solve your problems.


Tips for Delivering MySQL Database Performance - Part One

$
0
0

The database backend affects the application, which can then impact organizational performance. When this happens, those in charge tend to want a quick fix. There are many different roads to improve performance in MySQL. As a very popular choice for many organizations, it's pretty common to find a MySQL installation with the default configuration. This might not, however, be appropriate for your workload and setup needs.

In this blog, we will help you to better understand your database workload and the things that may cause harm to it. Knowledge of how to use limited resources is essential for anyone managing the database, especially if you run your production system on MySQL DB.

To ensure that the database performs as expected, we will start with the free MySQL monitoring tools. We will then look at the related MySQL parameters you can tweak to improve the database instance. We will also take a look at indexing as a factor in database performance management. 

To be able to achieve optimal usage of hardware resources, we’ll take a look into kernel optimization and other crucial OS settings. Finally, we will look into trendy setups based on MySQL Replication and how it can be examined in terms of performance lag. 

Identifying MySQL Performance Issues

This analysis helps you to understand the health and performance of your database better. The tools listed below can help to capture and understand every transaction, letting you stay on top of its performance and resource consumption.

PMM (Percona Monitoring and Management)

Percona Monitoring and Management tool is an open-source collection of tools dedicated to MySQL, MongoDB, and MariaDB databases (on-premise or in the cloud). PPM is free to use, and it's based on the well known Grafana and Prometheus time series DB. It Provides a thorough time-based analysis for MySQL.  It offers preconfigured dashboards that help to understand your database workload.

PMM uses a client/server model. You'll have to download and install both the client and the server. For the server, you can use Docker Container. It's as easy as pulling the PMM server docker image, creating a container, and launching PMM.

Pull PMM Server Image

docker pull percona/pmm-server:2

2: Pulling from percona/pmm-server

ab5ef0e58194: Downloading  2.141MB/75.78MB

cbbdeab9a179: Downloading  2.668MB/400.5MB

Create PMM Container

docker create \

   -v /srv \

   --name pmm-data \

   percona/pmm-server:2 /bin/true

Run Container

docker run -d \

   -p 80:80 \

   -p 443:443 \

   --volumes-from pmm-data \

   --name pmm-server \

   --restart always \

   percona/pmm-server:2

You can also check how it looks without an installation. A demo of PMM is available here.

Another tool that is part of PMM tools set is Query Analytics (QAN). QAN tool stays on top of the execution time of queries. You can even get details of SQL queries. It also gives a historical view of the different parameters that are critical for the optimal performance of a MySQL Database Server. This often helps to understand if any changes in the code could harm your performance. For example, a new code was introduced without your knowledge.  A simple use would be to display current SQL queries and highlight issues to help you improve the performance of your database.

PMM offers point-in-time and historical visibility of MySQL database performance. Dashboards can be customized to meet your specific requirements. You can even expand a particular panel to find the information you want about a past event.

Free Database Monitoring with ClusterControl

ClusterControl provides real-time monitoring of the entire database infrastructure. It supports various database systems starting with MySQL, MariaDB, PerconaDB, MySQL NDB Cluster, Galera Cluster (both Percona and MariaDB), MongoDB, PostgreSQL and TimescaleDB. The monitoring and deployment modules are free to use.

ClusterControl consists of several modules. In the free ClusterControl Community Edition we can use:

Performance advisors offer specific advice on how to address database and server issues, such as performance, security, log management, configuration, and capacity planning. Operational reports can be used to ensure compliance across hundreds of instances. However, monitoring is not management. ClusterControl has features like backup management, automated recovery/failover, deployment/scaling, rolling upgrades, security/encryption, load balancer management, and so on.

Monitoring & Advisors

The ClusterControl Community Edition offers free database monitoring which provides a unified view of all of your deployments across data centers and lets you drill down into individual nodes. Similar to PMM we can find dashboards based on real-time data. It’s to know what is happening now, with high-resolution metrics for better accuracy, pre-configured dashboards, and a wide range of third-party notification services for alerting.

On-premises and cloud systems can be monitored and managed from one single point. Intelligent health-checks are implemented for distributed topologies, for instance, detection of network partitioning by leveraging the load balancer’s view of the database nodes.

ClusterControl Workload Analytics in one of the monitoring components which can easily help you to track your database activities. It provides clarity into transactions/queries from applications. Performance exceptions are never expected, but they do occur and are easy to miss in a sea of data. Outlier discovery will get any queries that suddenly start to execute much slower than usual. It tracks the moving average and standard deviation for query execution times and detects/alerts when the difference between the value exceeds the mean by two standard deviations. 

As we can see from the below picture, we were able to catch some queries that in between one day tend to change execution time on a specific time. 

To install ClusterControl click here and download the installation script. The install script will take care of the necessary installation steps. 

You should also check out the ClusterControl Demo to see it in action.

You can also get a docker image with ClusterControl.

$ docker pull severalnines/clustercontrol

For more information on this, follow this article.

MySQL Database Indexing

Without an index, running that same query results in a scan of every row for the needed data. Creating an index on a field in a table creates extra data structure, which is the field value, and a pointer to the record it relates to. In other words, indexing produces a shortcut, with much faster query times on expansive tables. Without an index, MySQL must begin with the first row and then read through the entire table to find the relevant rows. 

Generally speaking, indexing works best on those columns that are the subject of the WHERE clauses in your commonly executed queries.

Tables can have multiple indexes. Managing indexes will inevitably require being able to list the existing indexes on a table. The syntax for viewing an index is below.

To check indexes on MySQL table run:

SHOW INDEX FROM table_name;

Since indices are only used to speed up the searching for a matching field within the records, it stands to reason that indexing fields used only for output would be simply a waste of disk space. Another side effect is that indexes may extend insert or delete operations, and thus when not needed, should be avoided.

MySQL Database Swappiness

On servers where MySQL is the only service running, it’s a good practice to set vm.swapiness = 1. The default setting is set to 60 which is not appropriate for a database system.

vi /etc/sysctl.conf
vm.swappiness = 1

Transparent Huge Pages

If you are running your MySQL on RedHat, make sure that Transparent Huge Pages is disabled.

This can be checked by command:

cat /proc/sys/vm/nr_hugepages
0

(0 means that transparent huge pages are disabled.)

MySQL I/O Scheduler 

In most distributions noop or deadline I/O schedulers should be enabled by default. To check it run

cat /sys/block/sdb/queue/scheduler 

MySQL Filesystem Options

It’s recommended to use journaled file systems like xfs, ext4 or btrfs. MySQL works fine with all that of them and the differences more likely will come with supported maximum file size.

  • XFS (maximum filesystem size 8EB, maximum file size 8EB)
  • XT4 (maximum filesystem size 8EB, maximum file size 16TB)
  • BTRFS (maximum filesystem size 16EB, maximum file size 16EB)

The default file system settings should apply fine.

NTP Deamon

It’s a good best practice to install NTP time server demon on database servers. Use one of the following system commands.

#Red Hat
yum install ntp
#Debian
sudo apt-get install ntp

Conclusion

This is all for part one. In the next article, we will continue with MySQL variables operating systems settings and useful queries to gather database performance status. 


Using OpenVPN to Secure Access to Your Database Cluster in the Cloud

$
0
0

The internet is a dangerous place, especially if you’re leaving your data unencrypted or without proper security. There are several ways to secure your data; all at different levels. You should always have a strong firewall policy,  data encryption, and a strong password policy. Another way to secure your data is by accessing it using a VPN connection. 

Virtual Private Network (or VPN) is a connection method used to add security and privacy to private and public networks, protecting your data.

OpenVPN is a fully-featured, open source, SSL VPN solution to secure communications. It can be used for remote access or communication between different servers or data centers. It can be installed on-prem or in the cloud, in different operating systems, and can be configured with many security options.

In this blog, we’ll create a VPN connection to access a database in the cloud. There are different ways to achieve this goal, depending on your infrastructure and how much hardware resources you want to use for this task. 

For example, you can create two VM, one on-prem and another one in the cloud, and they could be a bridge to connect your local network to the database cloud network through a Peer-to-Peer VPN connection.

Another simpler option could be connecting to a VPN server installed in the database node using a VPN client connection configured in your local machine. In this case, we’ll use this second option. You’ll see how to configure an OpenVPN server in the database node running in the cloud, and you’ll be able to access it using a VPN client.

For the database node, we’ll use an Amazon EC2 instance with the following configuration:

  • OS: Ubuntu Server 18.04
  • Public IP Address: 18.224.138.210
  • Private IP Address: 172.31.30.248/20
  • Opened TCP ports: 22, 3306, 1194

How to Install OpenVPN on Ubuntu Server 18.04

The first task is to install the OpenVPN server in your database node. Actually, the database technology used doesn’t matter as we’re working on a networking layer, but for testing purposes after configuring the VPN connection, let’s say we’re running Percona Server 8.0.

So let’s start by installing the OpenVPN packages.

$ apt install openvpn easy-rsa

As OpenVPN uses certificates to encrypt your traffic, you’ll need EasyRSA for this task. It’s a CLI utility to create a root certificate authority, and request and sign certificates, including sub-CAs and certificate revocation lists.

Note: There is a new EasyRSA version available, but to keep the focus on the OpenVPN installation, let’s use the EasyRSA version available in the Ubuntu 18.04 repository atm (EasyRSA version 2.2.2-2).

The previous command will create the directory /etc/openvpn/ for the OpenVPN configuration, and the directory /usr/share/easy-rsa/ with the EasyRSA scripts and configuration.

To make this task easier, let’s create a symbolic link to the EasyRSA path in the OpenVPN directory (or you can just copy it):

$ ln -s /usr/share/easy-rsa /etc/openvpn/

Now, you need to configure EasyRSA and create your certificates. Go to the EasyRSA location and create a backup for the “vars” file:

$ cd /etc/openvpn/easy-rsa

$ cp vars vars.bak

Edit this file, and change the following lines according to your information:

$ vi vars

export KEY_COUNTRY="US"

export KEY_PROVINCE="CA"

export KEY_CITY="SanFrancisco"

export KEY_ORG="Fort-Funston"

export KEY_EMAIL="me@myhost.mydomain"

export KEY_OU="MyOrganizationalUnit"

Then, create a new symbolic link to the openssl file:

$ cd /etc/openvpn/easy-rsa

$ ln -s openssl-1.0.0.cnf openssl.cnf

Now, apply the vars file:

$ cd /etc/openvpn/easy-rsa

$ . vars

NOTE: If you run ./clean-all, I will be doing a rm -rf on /etc/openvpn/easy-rsa/keys

Run the clean-all script:

$ ./clean-all

And create the Diffie-Hellman key (DH):

$ ./build-dh

Generating DH parameters, 2048 bit long safe prime, generator 2

This is going to take a long time

.....................................................................................................................................................................+

This last action could take some seconds, and when it’s finished, you will have a new DH file inside the “keys” directory in the EasyRSA directory.

$ ls /etc/openvpn/easy-rsa/keys

dh2048.pem

Now, let’s create the CA certificates.

$ ./build-ca

Generating a RSA private key

..+++++

...+++++

writing new private key to 'ca.key'

-----

You are about to be asked to enter information that will be incorporated

into your certificate request.

What you are about to enter is what is called a Distinguished Name or a DN.

There are quite a few fields but you can leave some blank

For some fields there will be a default value,

If you enter '.', the field will be left blank.

...

This will create the ca.crt (public certificate) and ca.key (private key). The public certificate will be required in all servers to connect to the VPN.

$ ls /etc/openvpn/easy-rsa/keys

ca.crt  ca.key

Now you have your CA created, let’s create the server certificate. In this case, we’ll call it “openvpn-server”:

$ ./build-key-server openvpn-server

Generating a RSA private key

.......................+++++

........................+++++

writing new private key to 'openvpn-server.key'

-----

You are about to be asked to enter information that will be incorporated

into your certificate request.

What you are about to enter is what is called a Distinguished Name or a DN.

There are quite a few fields but you can leave some blank

For some fields there will be a default value,

If you enter '.', the field will be left blank.

...

Certificate is to be certified until Dec 23 22:44:02 2029 GMT (3650 days)

Sign the certificate? [y/n]:y


1 out of 1 certificate requests certified, commit? [y/n]y


Write out database with 1 new entries

Data Base Updated

This will create the CRT, CSR, and Key files for the OpenVPN server:

$ ls /etc/openvpn/easy-rsa/keys

openvpn-server.crt  openvpn-server.csr openvpn-server.key

Now, you need to create the client certificate, and the process is pretty similar:

$ ./build-key openvpn-client-1

Generating a RSA private key

.........................................................................................+++++

.....................+++++

writing new private key to 'openvpn-client-1.key'

-----

You are about to be asked to enter information that will be incorporated

into your certificate request.

What you are about to enter is what is called a Distinguished Name or a DN.

There are quite a few fields but you can leave some blank

For some fields there will be a default value,

If you enter '.', the field will be left blank.

...

Certificate is to be certified until Dec 24 01:45:39 2029 GMT (3650 days)

Sign the certificate? [y/n]:y


1 out of 1 certificate requests certified, commit? [y/n]y


Write out database with 1 new entries

Data Base Updated

This will create the CRT, CSR, and Key files for the OpenVPN client:

$ ls /etc/openvpn/easy-rsa/keys

openvpn-client-1.csr  openvpn-client-1.crt openvpn-client-1.key

At this point, you have all the certificates ready. The next step will be to create both server and client OpenVPN configuration.

Configuring the OpenVPN Server

As we mentioned, the OpenVPN installation will create the /etc/openvpn directory, where you will add the configuration files for both server and client roles, and it has a sample configuration file for each one in /usr/share/doc/openvpn/examples/sample-config-files/, so you can copy the files in the mentioned location and modify them as you wish.

In this case, we’ll only use the server configuration file, as it’s an OpenVPN server:

$ cp /usr/share/doc/openvpn/examples/sample-config-files/server.conf.gz /etc/openvpn/

$ gunzip /etc/openvpn/server.conf.gz

Now, let’s see a basic server configuration file:

$ cat /etc/openvpn/server.conf

port 1194  

# Which TCP/UDP port should OpenVPN listen on?

proto tcp  

# TCP or UDP server?

dev tun  

# "dev tun" will create a routed IP tunnel,"dev tap" will create an ethernet tunnel.

ca /etc/openvpn/easy-rsa/keys/ca.crt  

# SSL/TLS root certificate (ca).

cert /etc/openvpn/easy-rsa/keys/openvpn-server.crt  

# Certificate (cert).

key /etc/openvpn/easy-rsa/keys/openvpn-server.key  

# Private key (key). This file should be kept secret.

dh /etc/openvpn/easy-rsa/keys/dh2048.pem  

# Diffie hellman parameters.

server 10.8.0.0 255.255.255.0  

# Configure server mode and supply a VPN subnet.

push "route 172.31.16.0 255.255.240.0"

# Push routes to the client to allow it to reach other private subnets behind the server.

keepalive 20 120  

# The keepalive directive causes ping-like messages to be sent back and forth over the link so that each side knows when the other side has gone down.

cipher AES-256-CBC  

# Select a cryptographic cipher.

persist-key  

persist-tun

# The persist options will try to avoid accessing certain resources on restart that may no longer be accessible because of the privilege downgrade.

status /var/log/openvpn/openvpn-status.log  

# Output a short status file.

log /var/log/openvpn/openvpn.log  

# Use log or log-append to override the default log location.

verb 3  

# Set the appropriate level of log file verbosity.

Note: Change the certificate paths according to your environment. 

And then, start the OpenVPN service using the created configuration file:

$ systemctl start openvpn@server

Check if the service is listening in the correct port:

$ netstat -pltn |grep openvpn

tcp        0 0 0.0.0.0:1194            0.0.0.0:* LISTEN   20002/openvpn

Finally, in the OpenVPN server, you need to add the IP forwarding line in the sysctl.conf file to allow the VPN traffic:

$ echo "net.ipv4.ip_forward=1" >> /etc/sysctl.conf

And run:

$ sysctl -p

net.ipv4.ip_forward = 1

Now, let’s see how to configure an OpenVPN client to connect to this new VPN.

Configuring the OpenVPN Client

In the previous point, we mentioned the OpenVPN sample configuration files, and we used the server one, so now let’s do the same but using the client configuration file.

Copy the file client.conf from /usr/share/doc/openvpn/examples/sample-config-files/ in the corresponding location and change it as you wish.

$ cp /usr/share/doc/openvpn/examples/sample-config-files/client.conf /etc/openvpn/

You’ll also need the following certificates created previously to configure the VPN client:

ca.crt

openvpn-client-1.crt

openvpn-client-1.key

So, copy these files to your local machine or VM. You’ll need to add this files location in the VPN client configuration file.

Now, let’s see a basic client configuration file:

$ cat /etc/openvpn/client.conf

client  

# Specify that we are a client

dev tun  

# Use the same setting as you are using on the server.

proto tcp  

# Use the same setting as you are using on the server.

remote 18.224.138.210 1194  

# The hostname/IP and port of the server.

resolv-retry infinite  

# Keep trying indefinitely to resolve the hostname of the OpenVPN server.

nobind  

# Most clients don't need to bind to a specific local port number.

persist-key  

persist-tun

# Try to preserve some state across restarts.

ca /Users/sinsausti/ca.crt  

cert /Users/sinsausti/openvpn-client-1.crt

key /Users/sinsausti/openvpn-client-1.key

# SSL/TLS parms.

remote-cert-tls server  

# Verify server certificate.

cipher AES-256-CBC  

# Select a cryptographic cipher.

verb 3  

# Set log file verbosity.

Note: Change the certificate paths according to your environment. 

You can use this file to connect to the OpenVPN server from different Operating Systems like Linux, macOS, or Windows.

In this example, we’ll use the application Tunnelblick to connect from a macOS client. Tunnelblick is a free, open source graphic user interface for OpenVPN on macOS. It provides easy control of OpenVPN clients. It comes with all the necessary packages like OpenVPN, EasyRSA, and tun/tap drivers.

As the OpenVPN configuration files have extensions of .tblk, .ovpn, or .conf, Tunnelblick can read all of them.

To install a configuration file, drag and drop it on the Tunnelblick icon in the menu bar or on the list of configurations in the 'Configurations' tab of the 'VPN Details' window.

And then, press on “Connect”.

Now, you should have some new routes in your client machine:

$ netstat -rn # or route -n on Linux OS

Destination        Gateway Flags        Netif Expire

10.8.0.1/32        10.8.0.5 UGSc         utun5

10.8.0.5           10.8.0.6 UH           utun5

172.31.16/20       10.8.0.5 UGSc         utun5

As you can see, there is a route to the local database network via the VPN interface, so you should be able to  access the database service using the Private Database IP Address.

$ mysql -p -h172.31.30.248

Enter password:

Welcome to the MySQL monitor.  Commands end with ; or \g.

Your MySQL connection id is 13

Server version: 8.0.18-9 Percona Server (GPL), Release '9', Revision '53e606f'


Copyright (c) 2000, 2019, Oracle and/or its affiliates. All rights reserved.


Oracle is a registered trademark of Oracle Corporation and/or its

affiliates. Other names may be trademarks of their respective

owners.


Type 'help;' or '\h' for help. Type '\c' to clear the current input statement.


mysql>

It’s working. Now you have your traffic secured using a VPN to connect to your database node.

Conclusion

Protecting your data is a must if you’re accessing it over the internet, on-prem, or on a mixed environment. You must know how to encrypt and secure your remote access. 

As you could see, with OpenVPN you can reach the remote database using the local network through an encrypted connection using self-signed certificates. So, OpenVPN looks like a great option for this task. It’s an open source solution, and the installation/configuration is pretty easy. We used a basic OpenVPN server configuration, so you can look for more complex configuration in the OpenVPN official documentation to improve your OpenVPN server.

Tips for Delivering MySQL Database Performance - Part Two

$
0
0

The management of database performance is an area that businesses when administrators often find themselves contributing more time to than they expected.

Monitoring and reacting to the production database performance issues is one of the most critical tasks within a database administrator job. It is an ongoing process that requires constant care. Application and underlying databases usually evolve with time; grow in size, number of users, workload, schema changes that come with code changes.

Long-running queries are seldom inevitable in a MySQL database. In some circumstances, a long-running query may be a harmful event. If you care about your database, optimizing query performance, and detecting long-running queries must be performed regularly. 

In this blog, we are going to take a more in-depth look at the actual database workload, especially on the running queries side. We will check how to track queries, what kind of information we can find in MySQL metadata, what tools to use to analyze such queries.

Handling The Long-Running Queries

Let’s start with checking Long-running queries. First of all, we have to know the nature of the query, whether it is expected to be a long-running or a short running query. Some analytic and batch operations are supposed to be long-running queries, so we can skip those for now. Also, depending on the table size, modifying table structure with ALTER command can be a long-running operation (especially in MySQL Galera Clusters).

  • Table lock - The table is locked by a global lock or explicit table lock when the query is trying to access it.
  • Inefficient query - Use non-indexed columns while lookup or joining, thus MySQL takes a longer time to match the condition.
  • Deadlock - A query is waiting to access the same rows that are locked by another request.
  • Dataset does not fit into RAM - If your working set data fits into that cache, then SELECT queries will usually be relatively fast.
  • Suboptimal hardware resources - This could be slow disks, RAID rebuilding, saturated network, etc.

If you see a query takes longer than usual to execute, do investigate it.

Using the MySQL Show Process List

​MYSQL> SHOW PROCESSLIST;

This is usually the first thing you run in the case of performance issues. SHOW PROCESSLIST is an internal mysql command which shows you which threads are running. You can also see this information from the information_schema.PROCESSLIST table or the mysqladmin process list command. If you have the PROCESS privilege, you can see all threads. You can see information like Query Id, execution time, who runs it, the client host, etc. The information with slightly wary depending on the MySQL flavor and distribution (Oracle, MariaDB, Percona)

SHOW PROCESSLIST;

+----+-----------------+-----------+------+---------+------+------------------------+------------------+----------+

| Id | User            | Host | db | Command | Time | State                  | Info | Progress |

+----+-----------------+-----------+------+---------+------+------------------------+------------------+----------+

|  2 | event_scheduler | localhost | NULL | Daemon  | 2693 | Waiting on empty queue | NULL   | 0.000 |

|  4 | root            | localhost | NULL | Query   | 0 | Table lock   | SHOW PROCESSLIST | 0.000 |

+----+-----------------+-----------+------+---------+------+------------------------+------------------+----------+

we can immediately see the offensive query right away from the output. In the above example that could be a Table lock.  But how often do we stare at those processes? This is only useful if you are aware of the long-running transaction. Otherwise, you wouldn't know until something happens - like connections are piling up, or the server is getting slower than usual.

Using MySQL Pt-query-digest

If you would like to see more information about a particular workload use pt-query-digest.  The pt-query-digest is a Linux tool from Percona to analyze MySQL queries. It’s part of the Percona Toolkit which you can find here. It supports the most popular 64 bit Linux distributions like Debian, Ubuntu, and Redhat. 

To install it you must configure Percona repositories and then install the perona-toolkit package.

Install Percona Toolkit using your package manager:

Debian or Ubuntu:

sudo apt-get install percona-toolkit

RHEL or CentOS:

sudo yum install percona-toolkit

Pt-query-digest accepts data from the process list, general log, binary log, slow log or tcpdump In addition to that, it’s possible to poll the MySQL process list at a defined interval - a process that can be resource-intensive and far from ideal, but can still be used as an alternative.

The most common source for pt-query-digest is a slow query log. You can control how much data will go there with parameter log_slow_verbosity.  

There are a number of things that may cause a query to take a longer time to execute:

  • microtime - queries with microsecond precision.
  • query_plan - information about the query’s execution plan.
  • innodb  - InnoDB statistics.
  • minimal - Equivalent to enabling just microtime.
  • standard - Equivalent to enabling microtime,innodb.
  • full - Equivalent to all other values OR’ed together without the profiling and profiling_use_getrusage options.
  • profiling - Enables profiling of all queries in all connections.
  • profiling_use_getrusage - Enables usage of the getrusage function.

source: Percona documentation

For completeness use log_slow_verbosity=full which is a common case.

Slow Query Log

The slow query log can be used to find queries that take a long time to execute and are therefore candidates for optimization. Slow query log captures slow queries (SQL statements that take more than long_query_time seconds to execute), or queries that do not use indexes for lookups (log_queries_not_using_indexes). This feature is not enabled by default and to enable it simply set the following lines and restart the MySQL server:

[mysqld]
slow_query_log=1
log_queries_not_using_indexes=1
long_query_time=0.1

The slow query log can be used to find queries that take a long time to execute and are therefore candidates for optimization. However, examining a long slow query log can be a time-consuming task. There are tools to parse MySQL slow query log files and summarize their contents like mysqldumpslow, pt-query-digest.

Performance Schema

Performance Schema is a great tool available for monitoring MySQL Server internals and execution details at a lower level. It had a bad reputation in an early version (5.6) because enabling it often caused performance issues, however the recent versions do not harm performance. The following tables in Performance Schema can be used to find slow queries:

  • events_statements_current
  • events_statements_history
  • events_statements_history_long
  • events_statements_summary_by_digest
  • events_statements_summary_by_user_by_event_name
  • events_statements_summary_by_host_by_event_name

MySQL 5.7.7 and higher include the sys schema, a set of objects that helps DBAs and developers interpret data collected by the Performance Schema into a more easily understandable form. Sys schema objects can be used for typical tuning and diagnosis use cases.

Network tracking

What if we don’t have access to the query log or direct application logs. In that case, we could use a combination of tcpdump and pt-query digest which could help to capture queries.

$ tcpdump -s 65535 -x -nn -q -tttt -i any port 3306 > mysql.tcp.txt

Once the capture process ends, we can proceed with processing the data:

$ pt-query-digest --limit=100% --type tcpdump mysql.tcp.txt > ptqd_tcp.out

ClusterControl Query Monitor

ClusterControl Query Monitor is a module in a cluster control that provides combined information about database activity. It can gather information from multiple sources like show process list or slow query log and present it in a pre-aggregated way. 

ClusterControl Top Queries

The SQL Monitoring is divided into three sections.

Top Queries

presents the information about queries that take a significant chunk of resources.

ClusterControl Top Queries

Running Queries

it’s a process list of information combined from all database cluster nodes into one view. You can use that to kill queries that affect your database operations.

ClusterControl Running Queries

Query Outliers

present the list of queries with execution time longer than average.

ClusterControl Query Outliners

Conclusion

This is all for part two. This blog is not intended to be an exhaustive guide to how to enhance database performance, but it hopefully gives a clearer picture of what things can become essential and some of the basic parameters that can be configured. Do not hesitate to let us know if we’ve missed any important ones in the comments below.


Announcing ClusterControl 1.7.5: Advanced Cluster Maintenance & Support for PostgreSQL 12 and MongoDB 4.2

$
0
0

We’re excited to announce the 1.7.5 release of ClusterControl - the only database management system you’ll ever need to take control of your open source database infrastructure. 

This new version features support for the latest MongoDB& PostgreSQL general releases as well as new operating system support allowing you to install ClusterControl on Centos 8 and Debian 10.

ClusterControl 1.7.4 provided the ability to place a node into Maintenance Mode. 1.7.5 now allows you to place (or schedule) the entire database cluster in Maintenance Mode, giving you more control over your database operations.

In addition, we are excited to announce a brand new function in ClusterControl we call “Freeze Frame.” This new feature will take snapshots of your MySQL or MariaDB setups right before a detected failure, providing you with invaluable troubleshooting information about what caused the issue. 

Release Highlights

Database Cluster-Wide Maintenance

  • Perform tasks in Maintenance-Mode across the entire database cluster.
  • Enable/disable cluster-wide maintenance mode with a cron-based scheduler.
  • Enable/disable recurring jobs such as cluster or node recovery with automatic maintenance mode.

MySQL Freeze Frame (BETA)

  • Snapshot MySQL status before cluster failure.
  • Snapshot MySQL process list before cluster failure (coming soon).
  • Inspect cluster incidents in operational reports or from the s9s command line tool.

New Operating System & Database Support

  • Centos 8 and Debian 10 support.
  • PostgreSQL 12 support.
  • MongoDB 4.2 and Percona MongoDB v4.0 support.

Additional Misc Improvements

  • Synchronize time range selection between the Overview and Node pages.
  • Improvements to the nodes status updates to be more accurate and with less delay.
  • Enable/Disable Cluster and Node recovery are now regular CMON jobs.
  • Topology view for Cluster-to-Cluster Replication.
 

View Release Details and Resources

Release Details

Cluster-Wide Maintenance 

The ability to place a database node into Maintenance Mode was implemented in the last version of ClusterControl (1.7.4). In this release we now offer the ability to place your entire database cluster into Maintenance Mode to allow you to perform updates, patches, and more.

MySQL & MariaDB Freeze Frame

This new ClusterControl feature allows you to get a snapshot of your MySQL statuses and related processes immediately before a failure is detected. This allows you to better understand what happened when troubleshooting, and provide you with actionable information on how you can prevent this type of failure from happening in the future. 

This new feature is not part of the auto-recovery features in ClusterControl. Should your database cluster go down those functions will still perform to attempt to get you back online; it’s just that now you’ll have a better idea of what caused it. 

Support for PostgreSQL 12

Released in October 2019, PostgreSQL 12 featured major improvements to indexing, partitioning, new SQL & JSON functions, and improved security features, mainly around authentication. ClusterControl now allows you to deploy a preconfigured Postgres 12 database cluster with the ability to fully monitor and manage it.

PostgreSQL GUI - ClusterControl

Support for MongoDB 4.2

MongoDB 4.2 offers unique improvements such as new ACID transaction guarantees, new query and analytics functions including new charts for rich data visualizations. ClusterControl now allows you to deploy a preconfigured MongoDB 4.2 or Percona Server for MongoDB 4.2 ReplicaSet with the ability to fully monitor and manage it.

MongoDB GUI - ClusterControl
 

Why Did My MySQL Database Crash? Get Insights with the New MySQL Freeze Frame

$
0
0

In case you haven't seen it, we just released ClusterControl 1.7.5  with major improvements and new useful features. Some of the features include Cluster Wide Maintenance, support for version CentOS 8 and Debian 10, PostgreSQL 12 Support, MongoDB 4.2 and Percona MongoDB v4.0 support, as well as the new MySQL Freeze Frame. 

Wait, but What is a MySQL Freeze Frame? Is This Something New to MySQL? 

Well it's not something new within the MySQL Kernel itself. It's a new feature we added to ClusterControl 1.7.5 that is specific to MySQL databases. The MySQL Freeze Frame in ClusterControl 1.7.5 will cover these following things:

  • Snapshot MySQL status before cluster failure.
  • Snapshot MySQL process list before cluster failure (coming soon).
  • Inspect cluster incidents in operational reports or from the s9s command line tool.

These are valuable sets of information that can help trace bugs and fix your MySQL/MariaDB clusters when things go south. In the future, we are planning to include also snapshots of the SHOW ENGINE InnoDB status values as well. So please stay tuned to our future releases.

Note that this feature is still in beta state, we expect to collect more datasets as we work with our users. In this blog, we will show you how to leverage this feature, especially when you need further information when diagnosing your MySQL/MariaDB cluster.

ClusterControl on Handling Cluster Failure

For cluster failures, ClusterControl does nothing unless Auto Recovery (Cluster/Node) is enabled just like below:

Once enabled, ClusterControl will try to recover a node or recover the cluster by bringing up the entire cluster topology. 

For MySQL, for example in a master-slave replication, it must have at least one master alive at any given time, regardless of the number of available slave/s. ClusterControl attempts to correct the topology at least once for replication clusters, but provides more retries for multi-master replication like NDB Cluster and Galera Cluster. Node recovery attempts to recover a failing database node, e.g. when the process was killed (abnormal shutdown), or the process suffered an OOM (Out-of-Memory). ClusterControl will connect to the node via SSH and try to bring up MySQL. We have previously blogged about How ClusterControl Performs Automatic Database Recovery and Failover, so please visit that article to learn more about the scheme for ClusterControl auto recovery.

In the previous version of ClusterControl < 1.7.5, those attempted recoveries triggered alarms. But one thing our customers missed was a more complete incident report with state information just before the cluster failure. Until we realized this shortfall and  added this feature in ClusterControl 1.7.5. We called it the "MySQL Freeze Frame". The MySQL Freeze Frame, as of this writing, offers a brief summary of incidents leading to cluster state changes just before the crash. Most importantly, it includes at the end of the report the list of hosts and their MySQL Global Status variables and values.

How Does MySQL Freeze Frame Differs With Auto Recovery?

The MySQL Freeze Frame is not part of the auto recovery of ClusterControl. Whether Auto Recovery is disabled or enabled, the MySQL Freeze Frame will always do its work as long as a cluster or node failure has been detected.

How Does MySQL Freeze Frame Work?

In ClusterControl, there are certain states that we classify as different types of Cluster Status. MySQL Freeze Frame will generate an incident report when these two states are triggered:

  • CLUSTER_DEGRADED
  • CLUSTER_FAILURE

In ClusterControl, a CLUSTER_DEGRADED is when you can write to a cluster, but one or more nodes are down. When this happens, ClusterControl will generate the incident report.

For CLUSTER_FAILURE, though its nomenclature explains itself, it is the state where your cluster fails and is no longer able to process reads or writes. Then that is a CLUSTER_FAILURE state. Regardless of whether an auto-recovery process is attempting to fix the problem or whether it's disabled, ClusterControl will generate the incident report.

How Do You Enable MySQL Freeze Frame?

ClusterControl's MySQL Freeze Frame is enabled by default and only generates an incident report only when the states CLUSTER_DEGRADED or CLUSTER_FAILURE are triggered or encountered. So there's no need on the user end to set any ClusterControl configuration setting, ClusterControl will do it for you automagically.

Locating the MySQL Freeze Frame Incident Report

As of this writing, there are 4-ways you can locate the incident report. These can be found by doing the following sections below.

Using the Operational Reports Tab

The Operational Reports from the previous versions are used only to create, schedule, or list the operational reports that have been generated by users. Since version 1.7.5, we included the incident report generated by our MySQL Freeze Frame feature. See the example below:

The checked items or items with Report type == incident_report, are the incident reports generated by MySQL Freeze Frame feature in ClusterControl.

Using Error Reports

By selecting the cluster and generating an error report, i.e. going through this process: <select the cluster> → Logs → Error Reports→ Create Error Report. This will include the incident report under the ClusterControl host.

Using s9s CLI Command Line

On a generated incident report, it does include instructions or hint on how you can use this with s9s CLI command. Below are what's shown in the incident report:

Hint! Using the s9s CLI tool allows you to easily grep data in this report, e.g:

s9s report --list --long

s9s report --cat --report-id=N

So if you want to locate and generate an error report, you can use this approach:

[vagrant@testccnode ~]$ s9s report --list --long --cluster-id=60

ID CID TYPE            CREATED TITLE                            

19  60 incident_report 16:50:27 Incident Report - Cluster Failed

20  60 incident_report 17:01:55 Incident Report

If I want to grep the wsrep_* variables on a specific host, I can do the following:

[vagrant@testccnode ~]$ s9s report --cat --report-id=20 --cluster-id=60|sed -n '/WSREP.*/p'|sed 's/  */ /g'|grep '192.168.10.80'|uniq -d

| WSREP_APPLIER_THREAD_COUNT | 4 | 192.168.10.80:3306 | 2020-01-09 08:50:24 |

| WSREP_CLUSTER_CONF_ID | 18446744073709551615 | 192.168.10.80:3306 | 2020-01-09 08:50:24 |

| WSREP_CLUSTER_SIZE | 1 | 192.168.10.80:3306 | 2020-01-09 08:50:24 |

| WSREP_CLUSTER_STATE_UUID | 7c7a9d08-2d72-11ea-9ef3-a2551fd9f58d | 192.168.10.80:3306 | 2020-01-09 08:50:24 |

| WSREP_EVS_DELAYED | 27ac86a9-3254-11ea-b104-bb705eb13dde:tcp://192.168.10.100:4567:1,9234d567-3253-11ea-92d3-b643c178d325:tcp://192.168.10.90:4567:1,9234d567-3253-11ea-92d4-b643c178d325:tcp://192.168.10.90:4567:1,9e93ad58-3241-11ea-b25e-cfcbda888ea9:tcp://192.168.10.90:4567:1,9e93ad58-3241-11ea-b25f-cfcbda888ea9:tcp://192.168.10.90:4567:1,9e93ad58-3241-11ea-b260-cfcbda888ea9:tcp://192.168.10.90:4567:1,9e93ad58-3241-11ea-b261-cfcbda888ea9:tcp://192.168.10.90:4567:1,9e93ad58-3241-11ea-b262-cfcbda888ea9:tcp://192.168.10.90:4567:1,9e93ad58-3241-11ea-b263-cfcbda888ea9:tcp://192.168.10.90:4567:1,b0b7cb15-3241-11ea-bdbc-1a21deddc100:tcp://192.168.10.100:4567:1,b0b7cb15-3241-11ea-bdbd-1a21deddc100:tcp://192.168.10.100:4567:1,b0b7cb15-3241-11ea-bdbe-1a21deddc100:tcp://192.168.10.100:4567:1,b0b7cb15-3241-11ea-bdbf-1a21deddc100:tcp://192.168.10.100:4567:1,b0b7cb15-3241-11ea-bdc0-1a21deddc100:tcp://192.168.10.100:4567:1,dea553aa-32b9-11ea-b321-9a836d562a47:tcp://192.168.10.100:4567:1,dea553aa-32b9-11ea-b322-9a836d562a47:tcp://192.168.10.100:4567:1,e27f4eff-3256-11ea-a3ab-e298880f3348:tcp://192.168.10.100:4567:1,e27f4eff-3256-11ea-a3ac-e298880f3348:tcp://192.168.10.100:4567:1 | 192.168.10.80:3306 | 2020-01-09 08:50:24 |

| WSREP_GCOMM_UUID | 781facbc-3241-11ea-8a22-d74e5dcf7e08 | 192.168.10.80:3306 | 2020-01-09 08:50:24 |

| WSREP_LAST_COMMITTED | 443 | 192.168.10.80:3306 | 2020-01-09 08:50:24 |

| WSREP_LOCAL_CACHED_DOWNTO | 98 | 192.168.10.80:3306 | 2020-01-09 08:50:24 |

| WSREP_LOCAL_RECV_QUEUE_MAX | 2 | 192.168.10.80:3306 | 2020-01-09 08:50:24 |

| WSREP_LOCAL_STATE_UUID | 7c7a9d08-2d72-11ea-9ef3-a2551fd9f58d | 192.168.10.80:3306 | 2020-01-09 08:50:24 |

| WSREP_PROTOCOL_VERSION | 10 | 192.168.10.80:3306 | 2020-01-09 08:50:24 |

| WSREP_PROVIDER_VERSION | 26.4.3(r4535) | 192.168.10.80:3306 | 2020-01-09 08:50:24 |

| WSREP_RECEIVED | 112 | 192.168.10.80:3306 | 2020-01-09 08:50:24 |

| WSREP_RECEIVED_BYTES | 14413 | 192.168.10.80:3306 | 2020-01-09 08:50:24 |

| WSREP_REPLICATED | 86 | 192.168.10.80:3306 | 2020-01-09 08:50:24 |

| WSREP_REPLICATED_BYTES | 40592 | 192.168.10.80:3306 | 2020-01-09 08:50:24 |

| WSREP_REPL_DATA_BYTES | 31734 | 192.168.10.80:3306 | 2020-01-09 08:50:24 |

| WSREP_REPL_KEYS | 86 | 192.168.10.80:3306 | 2020-01-09 08:50:24 |

| WSREP_REPL_KEYS_BYTES | 2752 | 192.168.10.80:3306 | 2020-01-09 08:50:24 |

| WSREP_ROLLBACKER_THREAD_COUNT | 1 | 192.168.10.80:3306 | 2020-01-09 08:50:24 |

| WSREP_THREAD_COUNT | 5 | 192.168.10.80:3306 | 2020-01-09 08:50:24 |

| WSREP_EVS_REPL_LATENCY | 4.508e-06/4.508e-06/4.508e-06/0/1 | 192.168.10.80:3306 | 2020-01-09 08:50:24 |

Manually Locating via System File Path

ClusterControl generates these incident reports in the host where ClusterControl runs. ClusterControl creates a directory in the/home/<OS_USER>/s9s_tmp or /root/s9s_tmp if you are using the root system user. The incident reports can be located, for example, by going to  /home/vagrant/s9s_tmp/60/galera/cmon-reports/incident_report_2020-01-09_085027.html where the format explains as,  /home/<OS_USER>/s9s_tmp/<CLUSTER_ID>/<CLUSTER_TYPE>/cmon-reports/<INCIDENT_FILE_NAME>.html. The full path of the file is also displayed when you hover your mouse in the item or file you want to check under the Operational Reports Tab just like below:

Are There Any Dangers or Caveats When Using MySQL Freeze Frame?

ClusterControl does not change nor modify anything in your MySQL nodes or cluster. MySQL Freeze Frame will just read SHOW GLOBAL STATUS (as of this time) at specific intervals to save records since we cannot predict the state of a MySQL node or cluster when it can crash or when it can have hardware or disk issues. It's not possible to predict this, so we save the values and therefore we can generate an incident report in case a particular node goes down. In that case, the danger of having this is close to none. It can theoretically add a series of client requests to the server(s) in case some locks are held within MySQL, but we have not noticed it yet.The series of tests doesn't show this so we would be glad if you can let us know or file a support ticket in case problems arise.

There are certain situations where an incident report might not be able to gather global status variables if a network issue was the problem prior to ClusterControl freezing a specific frame to gather data. That's completely reasonable because there's no way ClusterControl can collect data for further diagnosis as there's no connection to the node in the first place.

Lastly, you might wonder why not all variables are shown in the GLOBAL STATUS section? For the meantime, we set a filter where empty or 0 values are excluded in the incident report. The reason is that we want to save some disk space. Once these incident reports are no longer needed, you can delete it via Operational Reports Tab.

Testing the MySQL Freeze Frame Feature

We believe that you are eager to try this one and see how it works. But please, make sure you are not running or testing this in a live or production environment. We'll cover 2-phases of scenario in the MySQL/MariaDB, one for master-slave setup and one for Galera-type setup.

Master-Slave Setup Test Scenario

In a master-slave(s) setup, it's easy and simple to try. 

Step One

Make sure that you have disabled the Auto Recovery modes (Cluster and Node), like below:

so it won't try or attempt to fix the test scenario.

Step Two

Go to your Master node and try setting to read-only:

root@node1[mysql]> set @@global.read_only=1;

Query OK, 0 rows affected (0.000 sec)

Step Three

This time, an alarm was raised and so a generated incident report. See below how does my cluster looks like:

and the alarm was triggered:

and the incident report was generated:

Galera Cluster Setup Test Scenario

For Galera-based setup, we need to make sure that the cluster will be no longer available, i.e., a cluster-wide failure. Unlike the Master-Slave test, you can let Auto Recovery enabled since we'll play around with network interfaces.

Note: For this setup, ensure that you have multiple interfaces if you are testing the nodes in a remote instance since you cannot bring the interface up when you down that interface where you are connected.

Step One

Create a 3-node Galera cluster (for example using vagrant)

Step Two

Issue the command (just like below) to simulate network issue and do this to all the nodes

[root@testnode10 ~]# ifdown eth1

Device 'eth1' successfully disconnected.

Step Three

Now, it took my cluster down and have this state:

raised an alarm,

and it generates an incident report:

For a sample incident report, you can use this raw file and save it as html.

It's quite simple to try but again, please do this only in a non-live and non-prod environment.

Conclusion

MySQL Freeze Frame in ClusterControl can be helpful when diagnosing crashes. When troubleshooting, you need a wealth of information in order to determine cause and that is exactly what MySQL Freeze Frame provides.

Rebuilding a MySQL 8.0 Replication Slave Using a Clone Plugin

$
0
0

With MySQL 8.0 Oracle adopted a new approach to development. Instead of pushing features with major versions, almost every minor MySQL 8.0 version comes with new features or improvements. One of these new features is what we would like to focus on in this blog post. 

Historically MySQL did not come with good tools for provisioning. Sure, you had mysqldump, but it is just a logical backup tool, not really suitable for larger environments. MySQL enterprise users could benefit from MySQL Enterprise Backup while community users could use xtrabackup. Neither of those came with a clean MySQL Community deployments though. It was quite annoying as provisioning is a task you do quite often. You may need to build a new slave, rebuild a failed one - all of this will require some sort of a data transfer between separate nodes.

MySQL 8.0.17 introduced a new way of provisioning MySQL data - clone plugin. It was intended with MySQL Group Replication in mind to introduce a way of automatic provisioning and rebuilding of failed nodes, but its usefulness is not limited to that area. We can as well use it to rebuild a slave node or provision a new server. In this blog post we would like to show you how to set up MySQL Clone plugin and how to rebuild a replication slave.

First of all, the plugin has to be enabled as it is disabled by default. Once you do this, it will stay enabled through restarts. Ideally, you will do it on all of the nodes in the replication topology.

mysql> INSTALL PLUGIN clone SONAME 'mysql_clone.so';

Query OK, 0 rows affected (0.00 sec)

Clone plugin requires MySQL user with proper privileges. On donor it has to have “BACKUP_ADMIN” privilege while on the joiner it has to have “CLONE_ADMIN” privilege. Assuming you want to use the clone plugin extensively, you can just create user with both privileges. Do it on the master so the user will be created also on all of the slaves. After all, you never know which node will be a master some time in the future therefore it’s more convenient to have everything prepared upfront.

mysql> CREATE USER clone_user@'%' IDENTIFIED BY 'clonepass';

Query OK, 0 rows affected (0.01 sec)

mysql> GRANT BACKUP_ADMIN, CLONE_ADMIN ON *.* to clone_user@'%';

Query OK, 0 rows affected (0.00 sec)

MySQL Clone plugin has some prerequisites thus sanity checks should be performed. You should ensure that both donor and joiner will have the same values in the following configuration variables:

mysql> SHOW VARIABLES LIKE 'innodb_page_size';

+------------------+-------+

| Variable_name    | Value |

+------------------+-------+

| innodb_page_size | 16384 |

+------------------+-------+

1 row in set (0.01 sec)

mysql> SHOW VARIABLES LIKE 'innodb_data_file_path';

+-----------------------+-------------------------+

| Variable_name         | Value   |

+-----------------------+-------------------------+

| innodb_data_file_path | ibdata1:100M:autoextend |

+-----------------------+-------------------------+

1 row in set (0.01 sec)

mysql> SHOW VARIABLES LIKE 'max_allowed_packet';

+--------------------+-----------+

| Variable_name      | Value |

+--------------------+-----------+

| max_allowed_packet | 536870912 |

+--------------------+-----------+

1 row in set (0.00 sec)

mysql> SHOW GLOBAL VARIABLES LIKE '%character%';

+--------------------------+--------------------------------+

| Variable_name            | Value       |

+--------------------------+--------------------------------+

| character_set_client     | utf8mb4       |

| character_set_connection | utf8mb4                        |

| character_set_database   | utf8mb4       |

| character_set_filesystem | binary                         |

| character_set_results    | utf8mb4       |

| character_set_server     | utf8mb4       |

| character_set_system     | utf8       |

| character_sets_dir       | /usr/share/mysql-8.0/charsets/ |

+--------------------------+--------------------------------+

8 rows in set (0.00 sec)


mysql> SHOW GLOBAL VARIABLES LIKE '%collation%';

+-------------------------------+--------------------+

| Variable_name                 | Value |

+-------------------------------+--------------------+

| collation_connection          | utf8mb4_0900_ai_ci |

| collation_database            | utf8mb4_0900_ai_ci |

| collation_server              | utf8mb4_0900_ai_ci |

| default_collation_for_utf8mb4 | utf8mb4_0900_ai_ci |

+-------------------------------+--------------------+

4 rows in set (0.00 sec)

Then, on the master, we should double-check that undo tablespaces have unique names:

mysql> SELECT TABLESPACE_NAME, FILE_NAME FROM INFORMATION_SCHEMA.FILES

    ->        WHERE FILE_TYPE LIKE 'UNDO LOG';

+-----------------+------------+

| TABLESPACE_NAME | FILE_NAME  |

+-----------------+------------+

| innodb_undo_001 | ./undo_001 |

| innodb_undo_002 | ./undo_002 |

+-----------------+------------+

2 rows in set (0.12 sec)

Default verbosity level does not show too much data regarding cloning process therefore we would recommend to increase it to have better insight into what is happening:

mysql> SET GLOBAL log_error_verbosity=3;

Query OK, 0 rows affected (0.00 sec)

To be able to start the process on our joiner, we have to configure a valid donor:

mysql> SET GLOBAL clone_valid_donor_list ='10.0.0.101:3306';

Query OK, 0 rows affected (0.00 sec)

mysql> SHOW VARIABLES LIKE 'clone_valid_donor_list';

+------------------------+-----------------+

| Variable_name          | Value |

+------------------------+-----------------+

| clone_valid_donor_list | 10.0.0.101:3306 |

+------------------------+-----------------+

1 row in set (0.00 sec)

Once it is in place, we can use it to copy the data from:

mysql> CLONE INSTANCE FROM 'clone_user'@'10.0.0.101':3306 IDENTIFIED BY 'clonepass';

Query OK, 0 rows affected (18.30 sec)

That’s it, the progress can be tracked in the MySQL error log on the joiner. Once everything is ready, all you have to do is to setup the replication:

mysql> CHANGE MASTER TO MASTER_HOST='10.0.0.101', MASTER_AUTO_POSITION=1;

Query OK, 0 rows affected (0.05 sec)

mysql> START SLAVE USER='rpl_user' PASSWORD='afXGK2Wk8l';

Query OK, 0 rows affected, 1 warning (0.01 sec)

Please keep in mind that Clone plugin comes with a set of limitations. For starters, it transfers only InnoDB tables so if you happen to use any other storage engines, you would have to either convert them to InnoDB or use another provisioning method. It also interferes with Data Definition Language - ALTERs will block and be blocked by cloning operations.

By default cloning is not encrypted so it could be used only in a secure environment. If needed, you can set up SSL encryption for the cloning process by ensuring that the donor has SSL configured and then define following variables on the joiner:

clone_ssl_ca=/path/to/ca.pem

clone_ssl_cert=/path/to/client-cert.pem

clone_ssl_key=/path/to/client-key.pem

Then, you need to add “REQUIRE SSL;” at the end of the CLONE command and the process will be executed with SSL encryption. Please keep in mind this is the only method to clone databases with data-at-rest encryption enabled.

As we mentioned at the beginning, cloning was, most likely, designed with MySQL Group Replication/InnoDB Cluster in mind but, as long as the limitations are not affecting particular use case, it can be used as a native way of provisioning any MySQL instance. We will see how broad of adoption it will have - possibilities are numerous. What’s already great is we now have another hardware-agnostic method we can use to provision servers in addition to Xtrabackup. Competition is always good and we are looking forward to see what the future holds.

 
Viewing all 606 articles
Browse latest View live